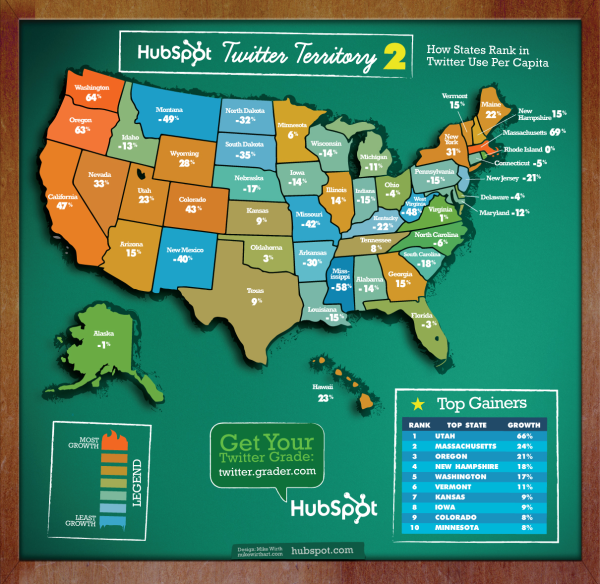
Ever wonder how your state stacks up to others in terms of Twitter usage?
A year ago we posted an infographic illustrating how states performed relative to each other based on their average Twitter Grade. This year, we used data from HubSpot's Twitter Grader to look at overall usage per capita.

The map illustrates this ranking - the numerical values represent how much higher or lower each state’s usage was compared the national average. The top 3 states were Massachusetts, Washington and Oregon, each with usage over 60% higher than the average. The West Coast was consistently above the mean while the rest of the country showed very little consistency by region.
We also looked at how the 50 states ranked in terms of growth from 2009 to 2010. Utah experienced the largest increase of all states and is now 23% above the national average. This swift and substantial gain might have been due in part to Twitter opening a new data center in Salt Lake City earlier this year.
Going into 2011, Twitter will be an especially important tool if you are trying to grow your business in any of the red "hot" states or a state with high growth rate.
Which states would you have expected to be on top?
Free Download: Twitter for Marketing and PR
|
Download the free webinar for tips and tricks to drive inbound marketing using Twitter. |


![Twitter is Dead (Kind of): Where X Stands With Consumers [New Data]](https://blog.hubspot.com/hubfs/Untitled%20design%20%2832%29-1.jpg)


![11 Twitter Alternatives Marketers Can Consider [Data + Expert Insights]](https://blog.hubspot.com/hubfs/Twitter%20Alternatives.jpg)


