Opinions expressed in this article are those of the sponsor. Search Engine Land neither confirms nor disputes any of the conclusions presented below.
7 tips to improve your website speed in 2024
Learn what you can do to improve the page load time and Google Core Web Vitals of your website.

A fast-loading website provides a good user experience and helps increase conversion rates. Google also recently updated its documentation to confirm that Core Web Vitals are used by its ranking systems.
Ready to make your website fast? Here are seven tips to help you analyze your site speed and identify potential optimizations.
1. Analyze a network request waterfall for your website
A request waterfall visualization can tell you exactly what happens when opening your website. For example:
- What resources are downloaded?
- When do resources start loading, and how long does each request take?
- How does this correlate with what visitors can see as the website is loading?
This information can serve as the basis for identifying the highest-impact optimizations. You can run a free page speed test on your website to generate a waterfall view.
Request waterfalls provide a lot of detail and can look intimidating. Let’s break down exactly what you need to look for.
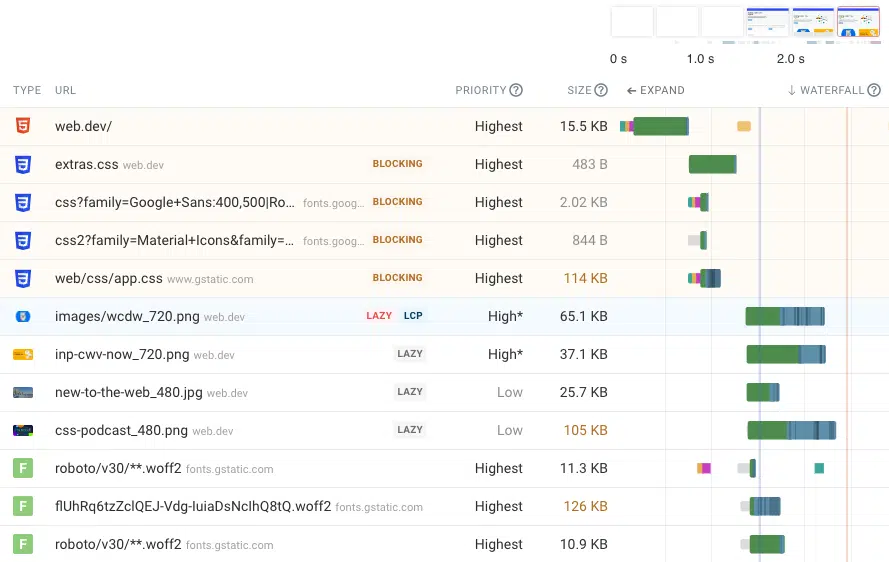
To interpret a waterfall, look for three key milestones in the loading process of a website:
- Time to First Byte (TTFB): How long does the website server take to return the HTML document?
- First Contentful Paint (FCP): When does the first page content become visible?
- Largest Contentful Paint (LCP): When does the largest content element become visible?
Unless there are redirects, the HTML document will be the first request in the waterfall. Before the TTFB milestone, no other resources can start loading and no content can become visible. Therefore your server TTFB represents a minimum value for the FCP and LCP scores.
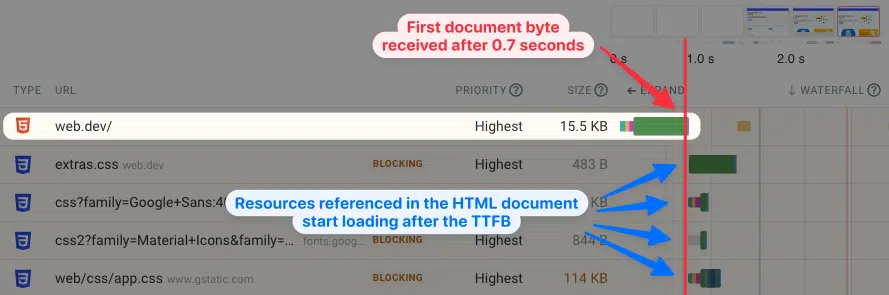
Next, we’ll look for render-blocking requests. These are requests for important additional resources that need to load before page content becomes visible.
In this example, we can see that there are four render-blocking CSS stylesheet requests. Once these files have finished loading we can see the first content appearing in the rendering filmstrip in the top right.

To optimize the FCP you can:
- Remove render-blocking resources altogether.
- Reduce the download size of CSS files.
- Load render-blocking scripts asynchronously.
- Speed up the resource requests themselves.
For example, in the example above we can see that the app.css file is over 100 kilobytes large. This can take some time to download, especially on slower mobile data connections.
To speed up requests, you’ll also want to look at what servers the browser is connecting to when opening the page. A new connection is needed for every new domain that a resource is loaded from, and each new server connection takes some time to establish.
You can identify server connections in the waterfall by looking for three small rectangles in front of the main request. These rectangles represent the network round trips needed for the DNS lookup, TCP connection and SSL connection.

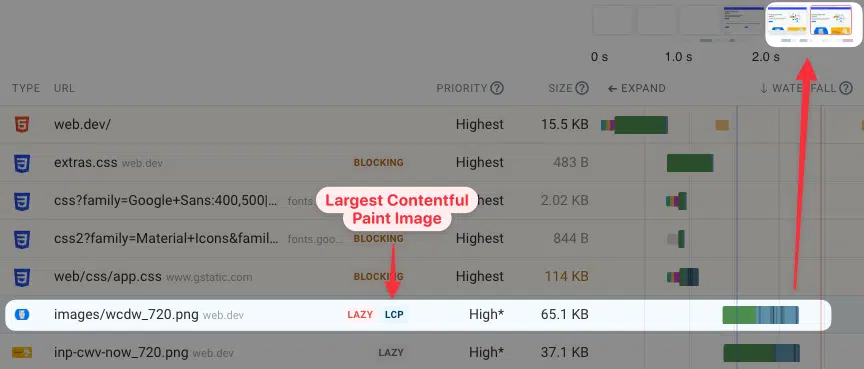
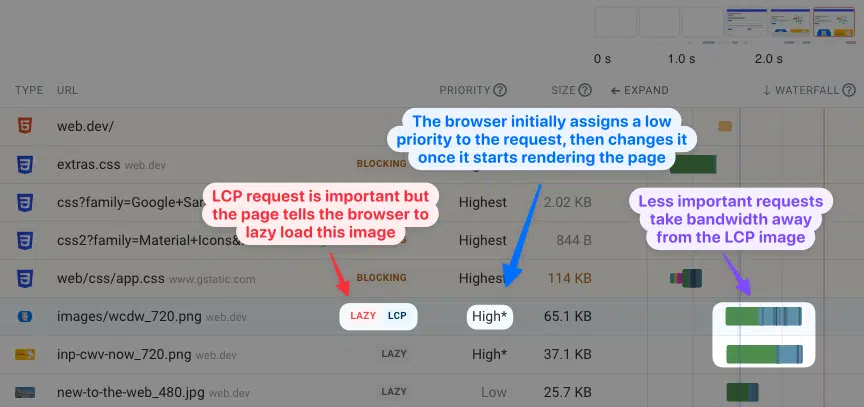
Finally, we’ll look at the LCP milestone. If the largest content element is an image this can usually be clearly seen by looking for the “LCP” badge in the waterfall view.
After the LCP image has been downloaded the browser quickly starts updating the page and displaying the image. You can see the LCP metric marked by the red line in the waterfall view.
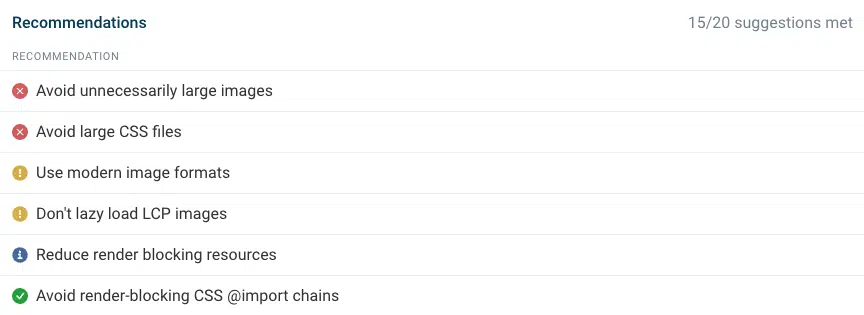
To make it easier to analyze the request waterfall data, many performance tools like DebugBear also include automated page speed recommendations.
2. Load the most important content first
When loading a website, less important content shouldn’t take bandwidth away from more important requests.
In the example above, lazy loading is applied to the LCP image. That means the browser won’t prioritize this resource. Once the page starts rendering the browser realizes that the image is actually important and the request priority is changed.
As a result, the image only starts loading late, and other requests also use up network bandwidth at that point. We can see that by looking at the dark blue lines in the request inside the waterfall. The dark blue lines show when response data is received for each request.
To ensure an LCP image is prioritized you can:
- Make sure it’s not lazy-loaded.
- Use the fetchpriority attribute to mark it as high importance.
- Consider using a preload tag to help the browser load the image early.
3. Reduce download sizes of key early requests
Larger files take longer to download, as bandwidth is limited and loading a large amount of data requires multiple network round trips between the client and the server.
For example, this screenshot shows a large CSS file:

AWhen we look into it more deeply we can see that it contains many images that have been embedded as text. That means that loading these images blocks rendering, even though they are not important for the page and may not be used at all.
To reduce file sizes you can:
- Use modern image formats like WebP and Avif.
- Use Brotli compression for text content (like HTML, CSS and JavaScript).
- Analyze your HTML or CSS code to identify embedded images, fonts and data.
4. Compare real user data to lab data
Google provides real user data for most websites as a part of their PageSpeed Insights tool. Comparing this data to the results of their lab-based Lighthouse test can help you better understand what’s happening on your website.
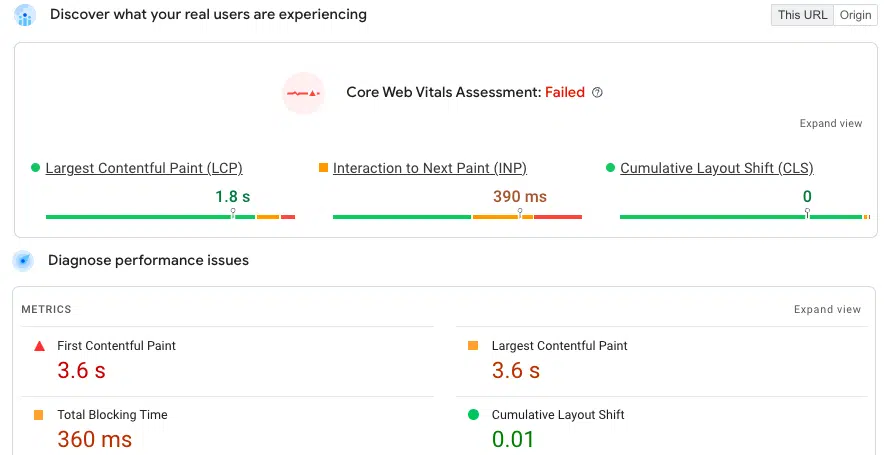
The lab test result typically reports worse metrics than real user data. That’s because the Lighthouse test uses a slower network connection and CPU than most visitors will have.
Two common reasons your lab testing results are faster than real user data:
- The PageSpeed insights test is reporting unreliable data.
- The lab test is hitting a cache while most real users experience slow server responses.
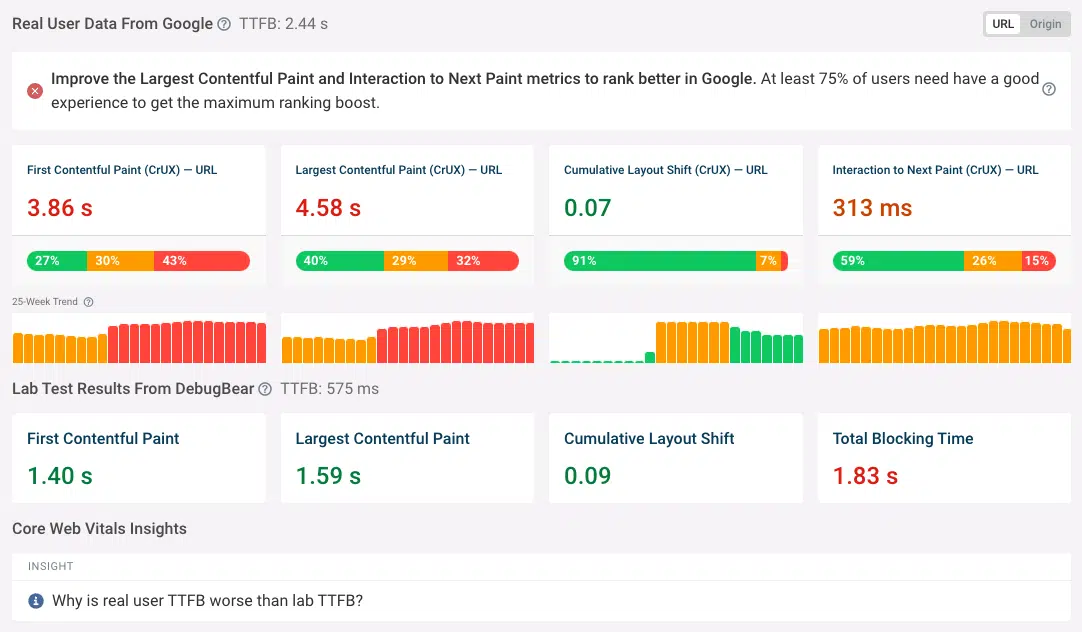
5. Check how your website performance has changed over time
The real user dataset that Google provides based on the Chrome User Experience report (CrUX) also includes historical data, even though it isn’t reported in PageSpeed Insights. Seeing how your website performance has changed over time lets you see when a problem was introduced and identify the root cause.
To view historical Core Web Vitals data for your website you can run a DebugBear Core Web Vitals test and then check the Web Vitals tab for a 25-week trend.
Each CrUX data value covers a rolling 28-day time period, if an issue occurs it will gradually impact your scores over the following four weeks.
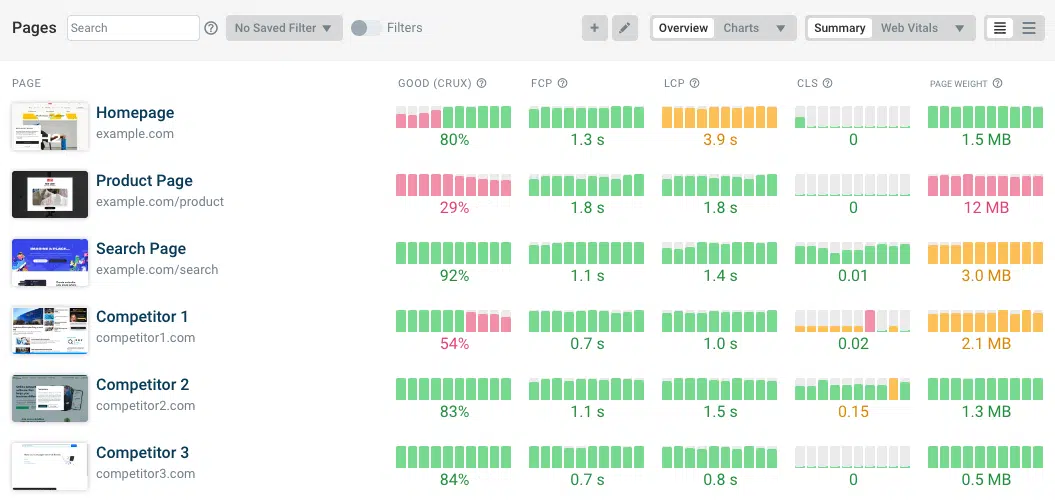
6. Set up continuous website speed monitoring
If you want to catch regressions (i.e., a change was deployed that had a negative impact on website speed) as soon as they happen you need to set up page speed monitoring for your website.
DebugBear is a monitoring service that provides two types of monitoring:
- Lab-based testing: Run page speed tests on a schedule in a controlled lab environment.
- Real-user monitoring: See how your visitors experience your website.
Setting up monitoring for your website will alert you whenever there’s a regression and then compare the data before and after to identify the cause of the slowdown.
7. Look at metrics beyond load time
Website performance isn’t just about the initial loading speed as measured by the LCP metric. Google also considers how quickly a website responds to user interactions, as measured by the Interaction to Next Paint (INP) metric that became a Core Web Vital on March 12.
While LCP mostly depends on what’s loaded over the network, INP looks at CPU processing and how long it takes before the page can process an interaction and update the UI to be ready for the next interaction.
Measuring INP requires user interaction, which makes it difficult to test in a lab environment. There are some lab-based INP testing tools like the INP Debugger, but they can’t identify all possible user interactions or tell you which elements users interact with most often.

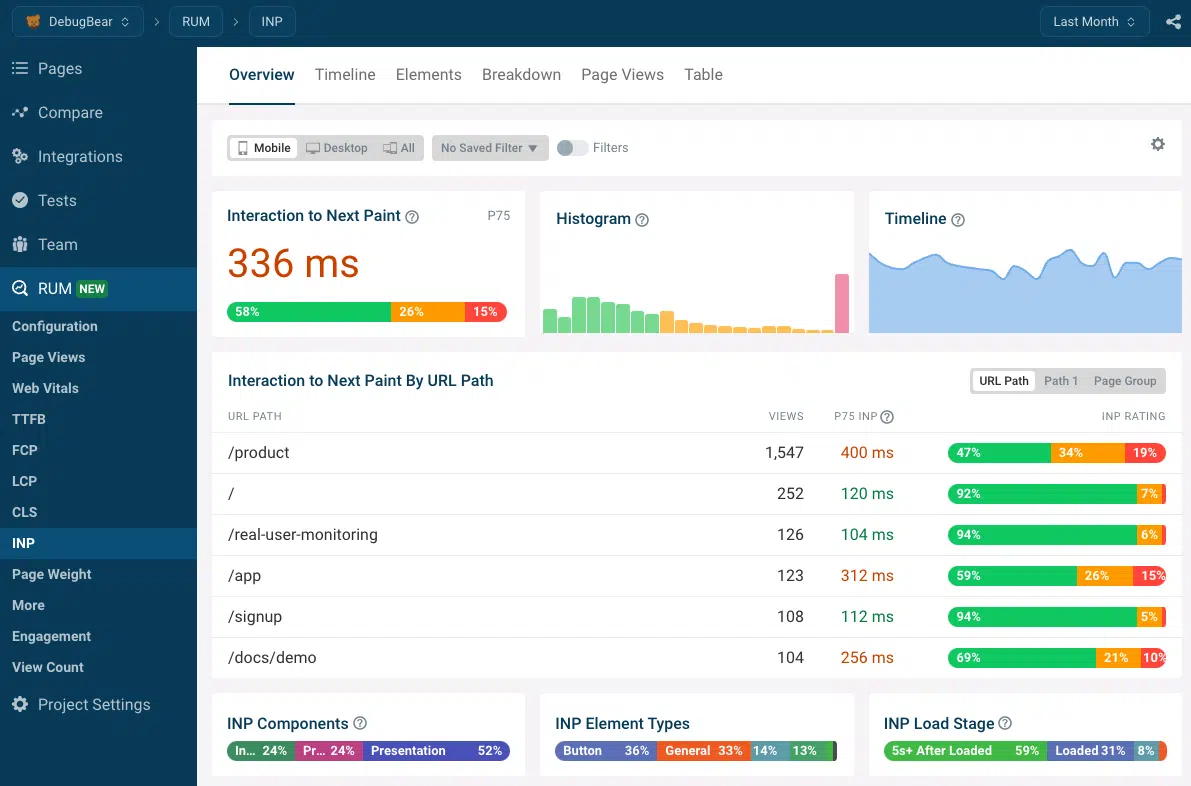
To improve Interaction to Next Paint you need real user monitoring (RUM) data. This data can tell you:
- What pages have slow INP?
- What elements users are interacting with?
- What scripts are contributing to delays?
Conclusion
To improve your website speed you first must understand what’s slowing it down. Start by running a free page speed test.
A website monitoring tool helps you keep track of Core Web Vitals over time and get notified of regressions. You can start a free 14-day trial of DebugBear here.
Related stories
New on Search Engine Land
About the author