Opinions expressed in this article are those of the sponsor. Search Engine Land neither confirms nor disputes any of the conclusions presented below.
How to improve and monitor Interaction to Next Paint
What you need to know about Interaction to Next Paint, Google’s new Core Web Vitals metric.
Google has announced that the new Interaction to Next Paint (INP) metric will become one of the three Core Web Vitals metrics on March 12, 2024. It’s replacing the older First Input Delay metric.
This marks the biggest change to the web vitals since Google first introduced them as a ranking factor in 2021.
What is Interaction to Next Paint?
The three Core Web Vitals metrics each measure a different aspect of the experience users have on your website. INP assesses how quickly your website responds to user interactions.
For example, if a visitor clicks on a button on your website and it takes a second for the updated page content to render, that represents a poor user experience.
Interaction to Next Paint measures how much time elapses between the user interaction and the next time the browser can update the content on the screen. The more CPU processing is required to handle the interaction and display the new content, the worse the INP score will be.

Does Interaction to Next impact Google rankings?
Google has confirmed that the Core Web Vitals are a ranking factor. That means if your site does worse on the INP score, it may rank lower than competitors that do well on all three web vitals metrics.
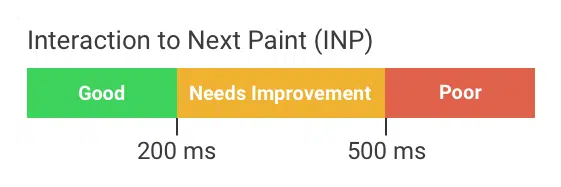
To get a good score, the INP should be below 200 milliseconds. A delay of over 500 milliseconds is considered poor. Your SEO is gradually impacted as INP worsens between the Good and Poor thresholds.
How does Google know how fast your website responds to user interactions? This data is collected from real Chrome users as part of the Chrome User Experience Report (CrUX).
How to test Interaction to Next Paint on your website
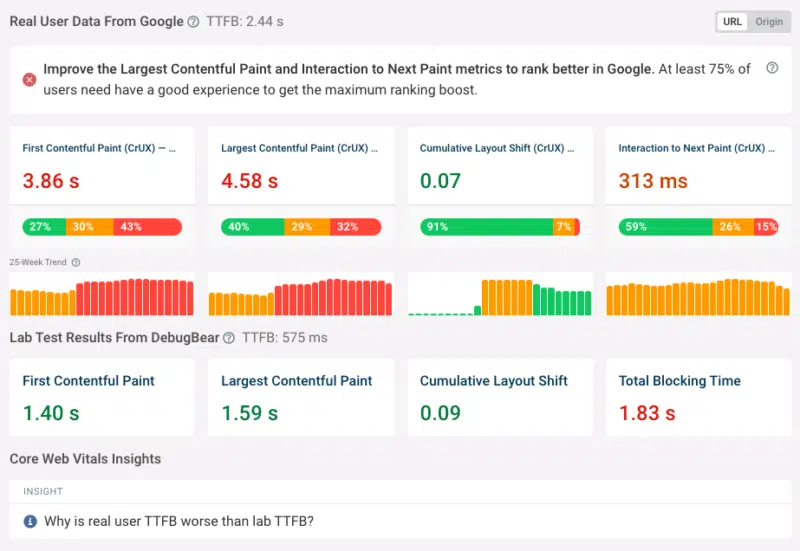
Want to find out how well your website does on the INP metric and other Core Web Vitals? Running a free Core Web Vitals test on your website is one quick way to check. Just enter a page URL and wait for the test result.
The real user Interaction to Next Paint data can be found in the Web Vitals tab. The 25-week trend lets you know whether the page is getting better or worse over time.
The data that’s shown here comes from the Google CrUX report.
To get a broader view of different page groups on your website, you can also check the Core Web Vitals tab in Google Search Console. Here you’ll see how many pages are affected by INP issues or otherwise don’t pass the Core Web Vitals assessment.
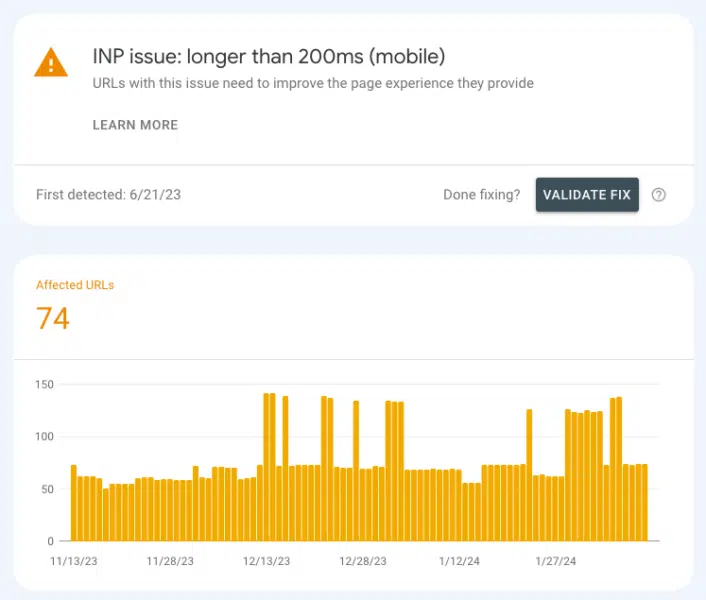
Unfortunately, the data Google provides isn’t very nuanced, and due to the page grouping mechanism, you may not be able to tell which specific pages are impacted by slow Interaction to next Paint.
Google CrUX data is also aggregated over 28 days. That means you’ll have to wait several weeks to see the impact of any optimizations.
To get more in-depth insight, a dedicated real-user Core Web Vitals monitoring tool like DebugBear can help. This way, you get detailed Core Web Vitals data across your whole website, updating as soon as a change is rolled out.
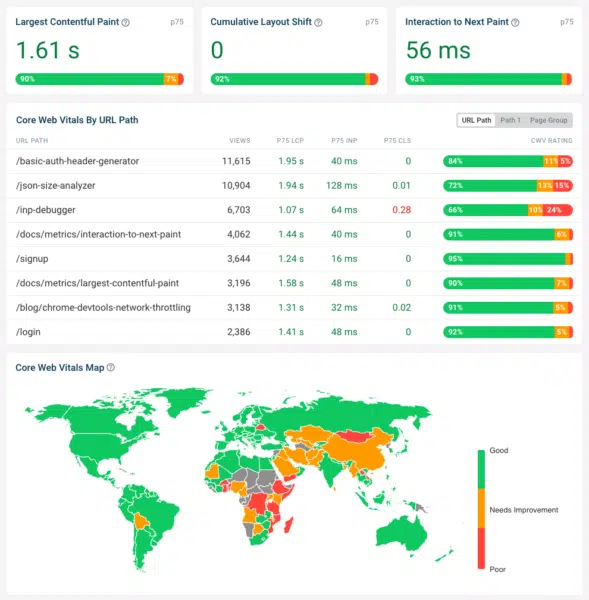
How do you speed up interactions and improve INP?
To improve INP scores on your website, you need to know what CPU processing is involved in a user interaction. INP can be divided into three components:
- Input delay: background tasks that prevent the browser from handling an interaction until after the tasks are complete
- Processing time: running code that handles the user interaction and schedules updates to the user interface
- Presentation delay: after UI updates are scheduled, the browser has to update the page layout and present the new content
The performance tab in Chrome DevTools shows how long interactions on the page took and what was responsible for the CPU processing.
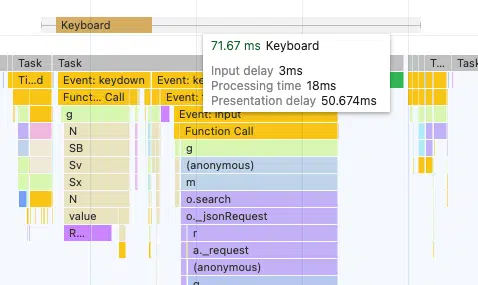
The data in the DevTools performance tab can be hard to read, so you’ll usually want a developer involved. But it provides an explanation for every millisecond that the browser spends while handling the event.
For example, you may find that:
- Third-party code is running in the background and slowing down interactions.
- The JavaScript code your website runs in response to an interaction must be optimized.
- You can schedule CPU tasks more efficiently to reduce the time that interactions are blocked.
Real user monitoring with DebugBear will show you which INP component contributes the most to poor responsiveness on your website.

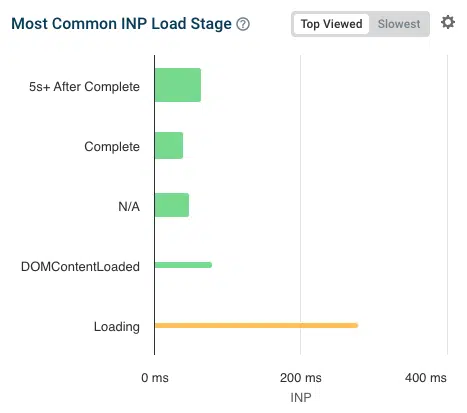
You’ll also often find that interactions take longer during the initial loading process of the website. That’s because when a page first starts loading, many small tasks are run in the background to set up the page, for example, loading ads or initializing a form or chat widget.
DebugBear shows a breakdown of how fast interactions are at different stages and how frequently interactions occur in these time periods (indicated by the height of the bar).
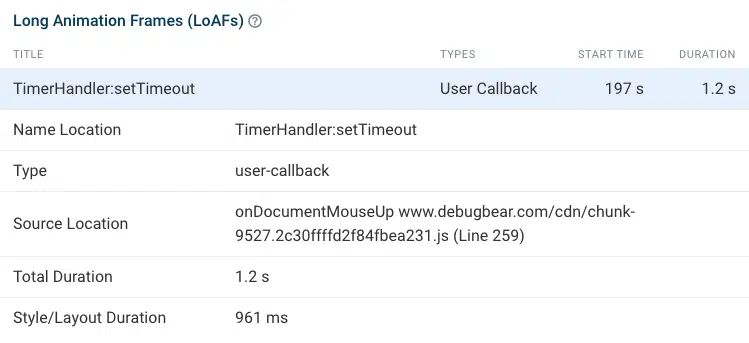
If your website supports the Long Animation Frames API, you’ll also be able to see specific scripts and JavaScript functions that are causing slow interactions for your visitors.
How do I know which page interactions are impacted by slow INP?
If you want to optimize your code and test interactions on your website, you need to know what elements users most often interact with on your website and which interactions often cause slow INP.
This isn’t data you can get from Google CrUX reports, but a dedicated Core Web Vitals monitoring tool like DebugBear will collect this information for you.
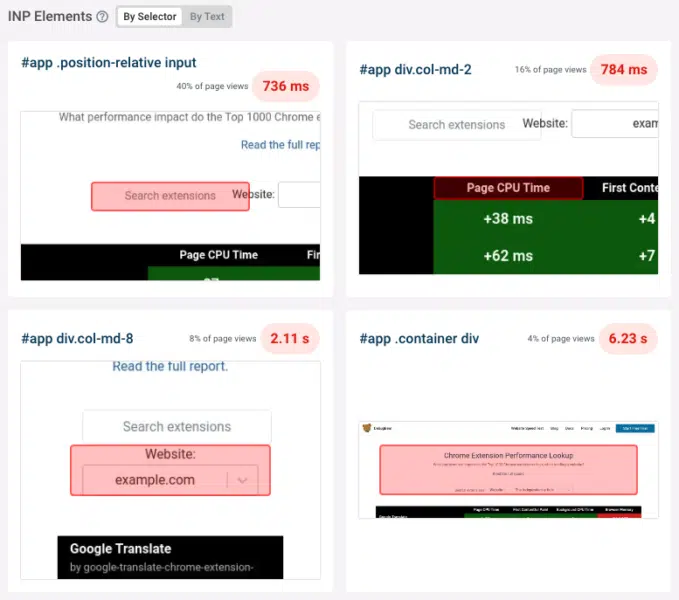
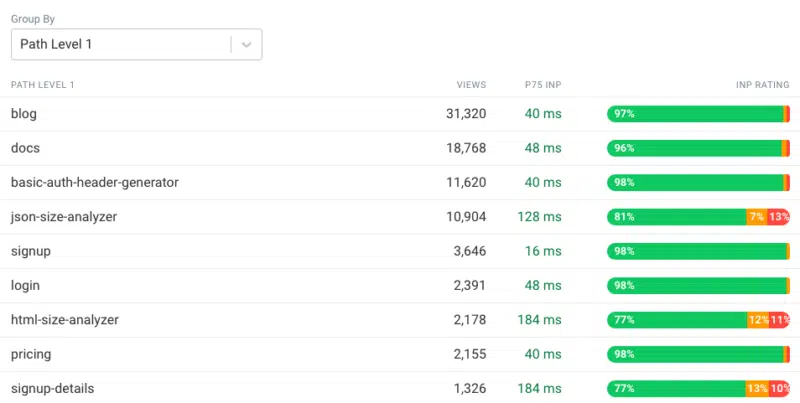
You can filter the data by page, device type, and many other factors to better understand how visitors experience your website. DebugBear reporting can give you targeted advice on how to improve Interaction to Next Paint.
How to monitor Interaction to Next Paint and other Core Web Vitals
A real user monitoring (RUM) solution can help you get ready for the new Interaction to Next Paint metric and help you stay on top of your Core Web Vitals over time.
Try DebugBear with a free 14-day trial. Continuously measure your web vitals and see what pages would benefit the most from optimizations.
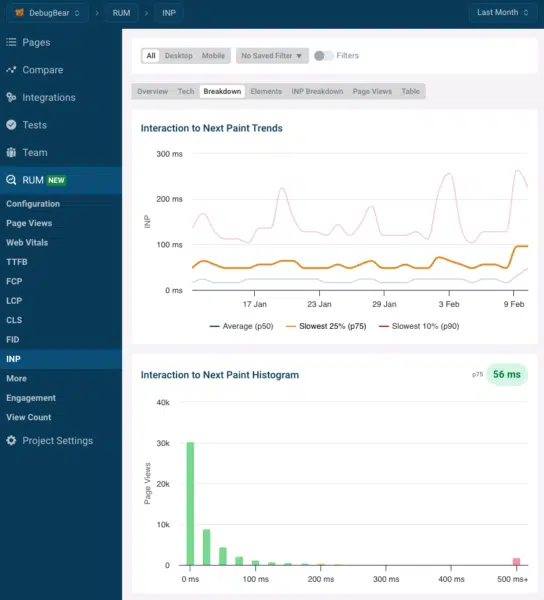
Simply install the DebugBear analytics snippet to gain insight into your visitor experiences. Avoid the 28-day delay that comes with Google’s web vitals data and get detailed reports you can use to deliver a better website experience and rank higher in Google.
Related stories
New on Search Engine Land
