3 steps for effective PPC reporting and analysis
An overview of how to make your reports on digital channels more useful and impactful for clients or stakeholders.
How you provide performance reports or insights can impact the rest of your project.
If a client or boss doesn’t understand your analysis of what’s happening in their PPC accounts, that can lead to more questions and stress for all parties – even if you’re doing great work.
The three steps outlined below will give you a solid foundation for PPC reporting that keeps everyone on the same page, establishes trust and makes your job easier in the long run.
Step 1: Highlight metrics and trends
The first step is easy. Simply review the account’s performance metrics, add a comparison date range and note any significant trends.
What someone thinks is “significant” may vary depending on who the report is delivered to.
It’s best to focus on the most relevant metrics before highlighting anything else and tailor your approach as needed.
Example 1: The main goal for a B2B software client is to drive leads efficiently.
- All your reports should start by highlighting conversion-oriented metrics, such as form submissions, cost per conversion, conversion rate, etc.
Example 2: The main goal for your ecommerce company is to drive sales.
- All reports should start by highlighting sales-based metrics, such as revenue, purchases, return on ad spend, etc.
Secondary metrics (for any account) might include click-through rate, cost per click, cost per thousand impressions (CPM), or search impression share. These give you a sense of overall visibility, efficiency and engagement.
While clicks and impressions can help identify trends in traffic and search volume, the focus should be on actual results – especially if you’re presenting to people at the executive or C-suite level.
This means that clicks and impressions may not be the best metrics to hone in on in your analysis.
It’s also important to highlight negative trends in addition to positive ones.
Transparency builds trust, prevents stakeholders from getting caught off guard by lower performance and helps you better control the narrative and next steps.
Dig deeper: 3 ways to stay on top of PPC performance
Step 2: Translate your metrics or trends to the real world
The next step is to define what your highlighted metrics actually mean.
Many people forget to do this because they know the terms. But not everyone knows as much as you do!
Providing that extra context ensures all parties interpret the data properly and prevents people from drawing inaccurate conclusions or focusing on things that might not matter in the long run.
Some common metrics and what they translate to in real terms include:
Overall volume
- Impressions: How much search volume there is or how large your audience may be.
- Clicks: How much traffic is driven to your website.
Reach / visibility
- Search impression share: How much coverage/visibility you have.
- Cost per thousand impressions (CPM): How efficiently you reach the target audience.
Efficiency
- Cost per click (CPC): How efficiently you drive traffic/engagement.
- Cost per conversion action (CPA): How efficiently you drive results.
Engagement
- Click-through rate (CTR): How effective/relevant your ad copy and creative is.
- Conversion rate: How effective/relevant your landing page or targeting is.
- View rate: How effective/relevant your video is.
Step 3: Identify reasons for performance shifts
The last step is to note any potential causes behind the trends you called out. This is where you can flex your expertise and let people know the value you bring to their organization.
- Did the click-through rate increase after you recommended and launched new ad copy?
- Are you seeing a jump in conversion rate after updating your landing pages?
- Did lead quality improve after adding negative keywords and placement exclusions in the previous month?
Give yourself some credit and highlight those changes in the report!
It’s also important to do this for negative trends because identifying the cause of a decline will help you determine the next best course of action.
For example, you see a decrease in impression share and an increase in average CPC.
You review the Auction Insights and notice a new competitor has entered your market.
Now you can strategize an approach to the situation and present a solution before it causes a bigger dent in performance.
That said, there might not always be a clear-cut reason for performance shifts.
In this situation, taking a step back and looking at the industry at a macro level can be helpful.
- If you’ve seen a drop in conversions, conversion rate, and impressions (i.e., search volume) for seemingly no reason, you might be experiencing seasonality. One way to verify this would be to check Google Trends data for your top terms. Another option is to meet with the sales team (or ask your client to meet with theirs) to discuss whether other channels are also seeing a dip in performance.
- The same applies when you see an unexpected improvement in account performance. This can also be a good time to ask about testing additional budget so that you can take advantage of high conversion intent.
- If you still aren’t sure what might be causing a shift (like dealing with conflicting data points), check how you compare to industry benchmarks. You might find that you don’t stack up well compared to others. In this case, you can determine the next steps as needed (e.g., below-average CTR means you should test new ad copy or creative). If you’re above average, you may see a short-term trend that isn’t a huge cause for concern.
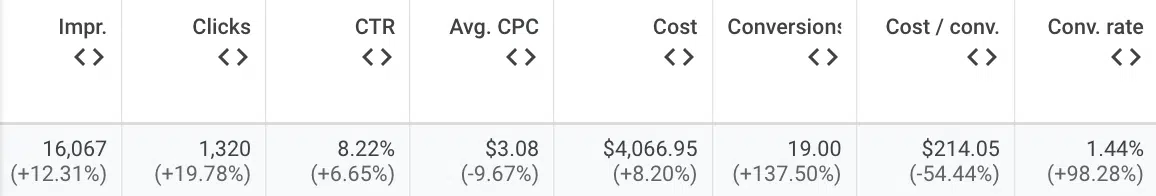
Putting it all together
By approaching reports using the process above, your analysis should end up looking something like this:

The result is a clear overview of:
- What’s happening in the account.
- Why it’s happening.
- What you plan to do next if action is needed.
In turn, clients and stakeholders typically feel more comfortable with the numbers they see and hear.
They may then have a greater appreciation and understanding of your work, leading to more trust and a willingness to test more. And that’s a win for everyone!
Dig deeper: How to deliver PPC results to executives: Get out of the weeds
Opinions expressed in this article are those of the guest author and not necessarily Search Engine Land. Staff authors are listed here.
Related stories
New on Search Engine Land
About the author