How Google SGE will impact your traffic – and 3 SGE recovery case studies
Learn how Google Search Generative Experience could affect your website's organic traffic in this in-depth analysis.
Much has been written about Google Search Generative Experience (SGE), but the most important questions remains unanswered:
- If and when Google SGE goes live, how will it impact organic traffic?
- Will our traffic drop, and if so, by how much?
- And what can we do about it?
This article presents a framework that can provide clear answers to these questions. Using this framework, we have:
- Estimated SGE traffic drops for 23 websites.
- Discovered an optimization technique that helps pages rank in the SGE snapshot carousel.
- Carried out three SGE recovery projects, in which we have mitigated (at least partially) the expected traffic drops from Google SGE.
We’ll share our data and findings, but more importantly, we’ll share our framework – which you can use yourself to understand the risk Google SGE poses to your websites and find solutions.
TL;DR
This article is quite extensive because we tried to give you everything you need to assess the impact of Google SGE and, in case of a major traffic drop, design your own SGE recovery project while sharing data from our own research.
Here are the key takeaways, with links to learn more further in this article:
- It’s possible to estimate how much traffic you’ll lose or gain from Google SGE.
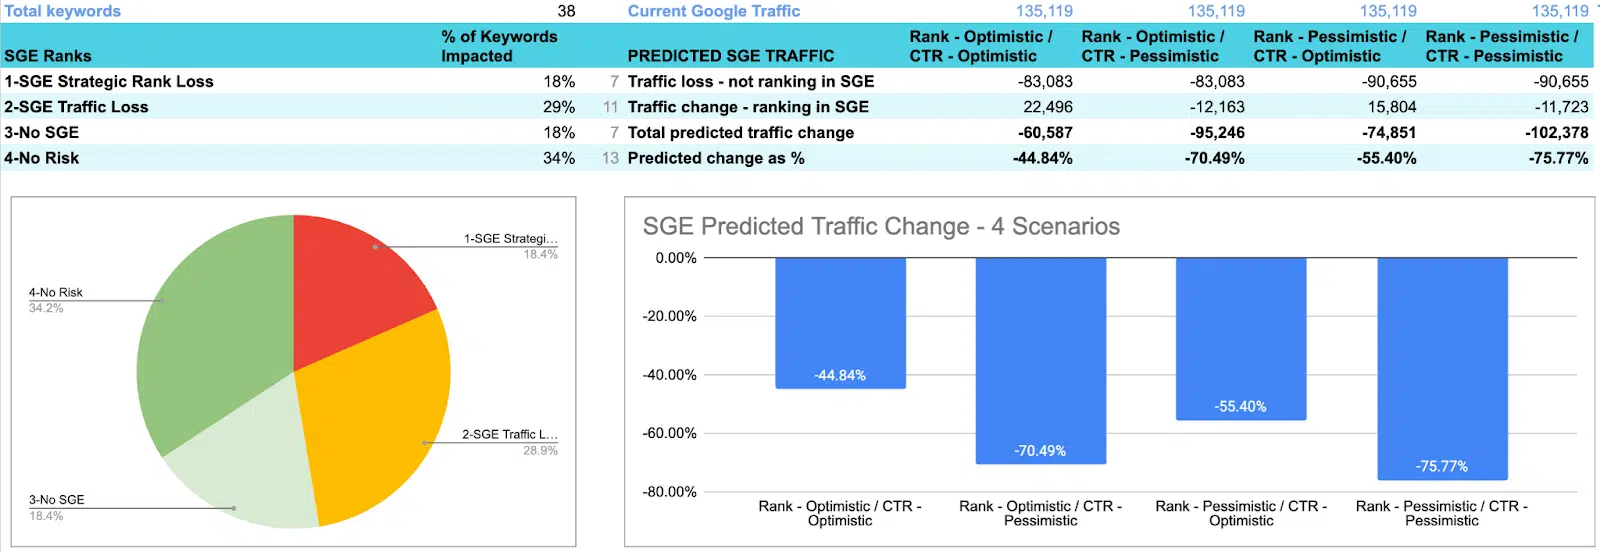
- We propose an open SGE Impact Model, which anyone can implement using an Excel spreadsheet. It will help you estimate, across a range of possible outcomes, what will happen to your traffic when SGE goes live. Below is an example of a real website, expected to lose between 44-75% of its organic traffic due to Google SGE. Learn how the model works.
- In a study of 23 websites, the aggregate organic traffic drop as a result of SGE was 18-64%.
- Our study focused on websites in the technology industry, with traffic mainly from informational keywords. There is large variance inside our sample, with some websites gaining as much as 219% in traffic while others are losing as much as 95%. See the results of the study.

- It’s possible to optimize pages to appear in SGE snapshot carousels.
- We have found such a technique, proved it in a controlled study, and executed it successfully across multiple websites. We provide an experimental framework that can help you find a technique that works for your niche in a matter of weeks. Learn how to design SGE experiments and see the results of our experiment.

- You can combine the SGE impact model and experimental framework to mitigate SGE risk.
- By analyzing which keywords are responsible for traffic drops, and optimizing them for SGE, you can save a website from a large expected traffic drop with relatively low effort. See how to design an SGE recovery project.
- We share results from the world’s first three SGE recovery projects.
- In our most successful project, a client expected to lose at least 79% of organic traffic is now expected to grow by 97% (in the most favorable scenario). To achieve this result, we optimized 11 existing pages for Google SGE and wrote four new “ideal pages” that are favorable to SGE. Read more about our three case studies.
Before
After

- We are committed to helping the community survive and grow from Google SGE.
- Join me on Thursday, Sept. 28 for a free webinar – Overcoming the Google SGE Challenge: Assessment and Recovery Strategies – in which we’ll go into more depth and take questions from the audience.
How the SGE impact model works
In order to deal with the risk of SGE, we first need to understand how our important keywords are ranking in the new search experience, and how those ranks translate into traffic.
By summing up the expected traffic in SGE and comparing it to current traffic, we can see if our organic traffic is expected to drop, or even possibly grow, when Google transitions to SGE.
We built a simple model to achieve this for an entire website, estimating the expected traffic change across four possible scenarios. We propose this as an open model for the community to use.
Anyone can use the principles below to build an SGE Impact spreadsheet in Excel or Google Docs, to understand how SGE will affect their website and get actionable insights for recovery.
Simplifying assumptions
Google SGE is a complex system and many parts of it are unknown. To model it, we use a few simplifying assumptions. These assumptions are debatable and are not universally true, but we believe them to be reasonable based on thousands of keywords we observed ranking in SGE:
- Assumption 1: If your page ranks in the snapshot carousel, you will get (some) organic traffic.
- Assumption 2: Traffic from the snapshot carousel will be equal to or less than the same rank on Google today.
- Assumption 3: If you don’t rank in the SGE snapshot carousel, but you do rank in the traditional 10 blue links, you won’t get any traffic (this is a conservative assumption; in reality, some users will probably scroll past SGE and click the blue links).
- Assumption 4: If the SGE experience is not active, you will rank the same as you do today.
Next, we use two parameters to define “how bad” or “how good” SGE will be for our websites: CTR and rank.
Click-through rate (CTR) in SGE
It is a mystery what will be the actual CTR of different positions in the SGE snapshot carousel. In our model, we take two extreme options, one optimistic and one pessimistic, to understand the range of possibilities between them.
In the table below, we show:
- Current Google CTRs for the top 10 positions, according to Advanced Web Rankings. This is live data for June 2023, for informational non-branded keywords. You can adapt the model to other types of keywords by using a different baseline CTR.
- CTR in Google SGE (Optimistic) The optimistic CTR for the top 10 positions is similar to Google today. This is our “best case”. The only change is that we expect the first three positions will get the same CTR, because they appear side by side, not one above the other like in Google today.
- CTR in Google SGE (Pessimistic). Here, we estimate that SGE will result in half the CTR for the top 10 positions. Again, we assume the first three positions in SGE have identical CTR.

Actual rank in SGE
If you have observed rankings for your favorite keywords in SGE, you probably noticed that ranks are quite volatile. Pages can disappear from the snapshot carousel, appear again, change in rank, and in some cases, the SGE experience does not appear at all. This means that in multiple observations of the same keyword, your page might have different ranks.
In our model, we take a set of rank observations and create two “ideal ranks”:
- Optimistic rank: This is the best rank seen. For example, if you checked three times and ranked 3, 5, and one time didn’t rank at all, the optimistic rank is 3.
- Pessimistic rank: The pessimistic rank is taken as ‘not ranking’ if the page wasn’t ranking in even one observation. If the page is ranking in all of them, we take the average. In the example above, the pessimistic rank is ‘not ranking’.
Four scenarios
Based on the parameters we describe above, we define four possible scenarios for SGE’s impact on traffic, from best to worst:
Best scenario
- Optimistic rank / Optimistic CTR: Across all keywords, we take the optimistic rank (best rank seen) and the optimistic CTR (like Google today).
Mixed scenario
- Optimistic rank / Pessimistic CTR: Across all keywords, we take the optimistic rank but combine it with the pessimistic CTR (half of the current CTR).
Mixed scenario
- Pessimistic rank / Optimistic CTR: Here we take the pessimistic rank combined with the optimistic CTR (like Google today).
Worst scenario
- Pessimistic rank / Pessimistic CTR: This is the worst possible case, combining the pessimistic rank with pessimistic CTR (half of what we have today).
Selection of keywords
This is a critical part of our SGE model. We want the model to be actionable – in other words, we want to optimize and improve traffic based on the results of this model. So, we aim to find a small set of keywords that “explains” most of the organic traffic.
Here are a few steps you can take to find the 20% of keywords that make 80% of the impact for your website:
- Identify the “SEO-relevant” traffic on the site. If there are sections on your site that you don’t optimize or “don’t care about” for SEO purposes, exclude them from the analysis.
- Identify the top pages that drive at least 70% of organic traffic. Typically, even if you have thousands of pages, there will be only a handful that drive most of the traffic.
- For each page, select one representative keyword. In most cases, even if a page is ranking for many keywords, there is one “flagship keyword” you can identify for that page. If that keyword ranks, probably most of the others will rank as well.
Using this process, you can arrive at around 10-50 keywords (for small websites) or up to hundreds of keywords for larger websites that drive most of your SEO traffic. These are the keywords you should use to estimate SGE impact.
In addition, identify strategic keywords – these are keywords that, even if they didn’t show up in the above analysis, are strategically important for the business. We want to make sure they rank in SGE.
Results of our SGE impact model for 23 websites
You must be curious to see what our model shows in terms of traffic drops (or growth!) for actual websites. Here are the results:
The dataset
Our agency, Agile SEO, specializes in the technology industry.
We ran our impact model on 23 client websites, all corporate websites of startups or established technology companies focusing on informational keywords in their SEO efforts.
They all have between 100-10,000 indexed pages, and between 1,000 to 300,000 monthly organic visits.
Keyword ranks
The pie chart below shows what is expected to happen to our clients’ most important keywords when SGE goes live.

There are 1,242 high-impact keywords we identified across all 23 websites.
The dramatic finding is that 64% of strategic or high-traffic keywords are losing rank in SGE – they do not appear in the SGE snapshot carousel.
On the bright side, 27% keywords have no risk – this means that the expected traffic in SGE is the same or higher as it is today or that strategic keywords are still ranking roughly as they are today.
Another important finding is that 8% of keywords have no SGE. We have seen a similar number of 8-10% across multiple studies, indicating that Google does actually activate the SGE experience for the vast majority of keywords.
Aggregate traffic in SGE
Below, we see what is expected to happen to the overall traffic of all 23 websites.
We are analyzing 628,000 monthly organic visits (driven by the 1,242 high-impact keywords seen above).
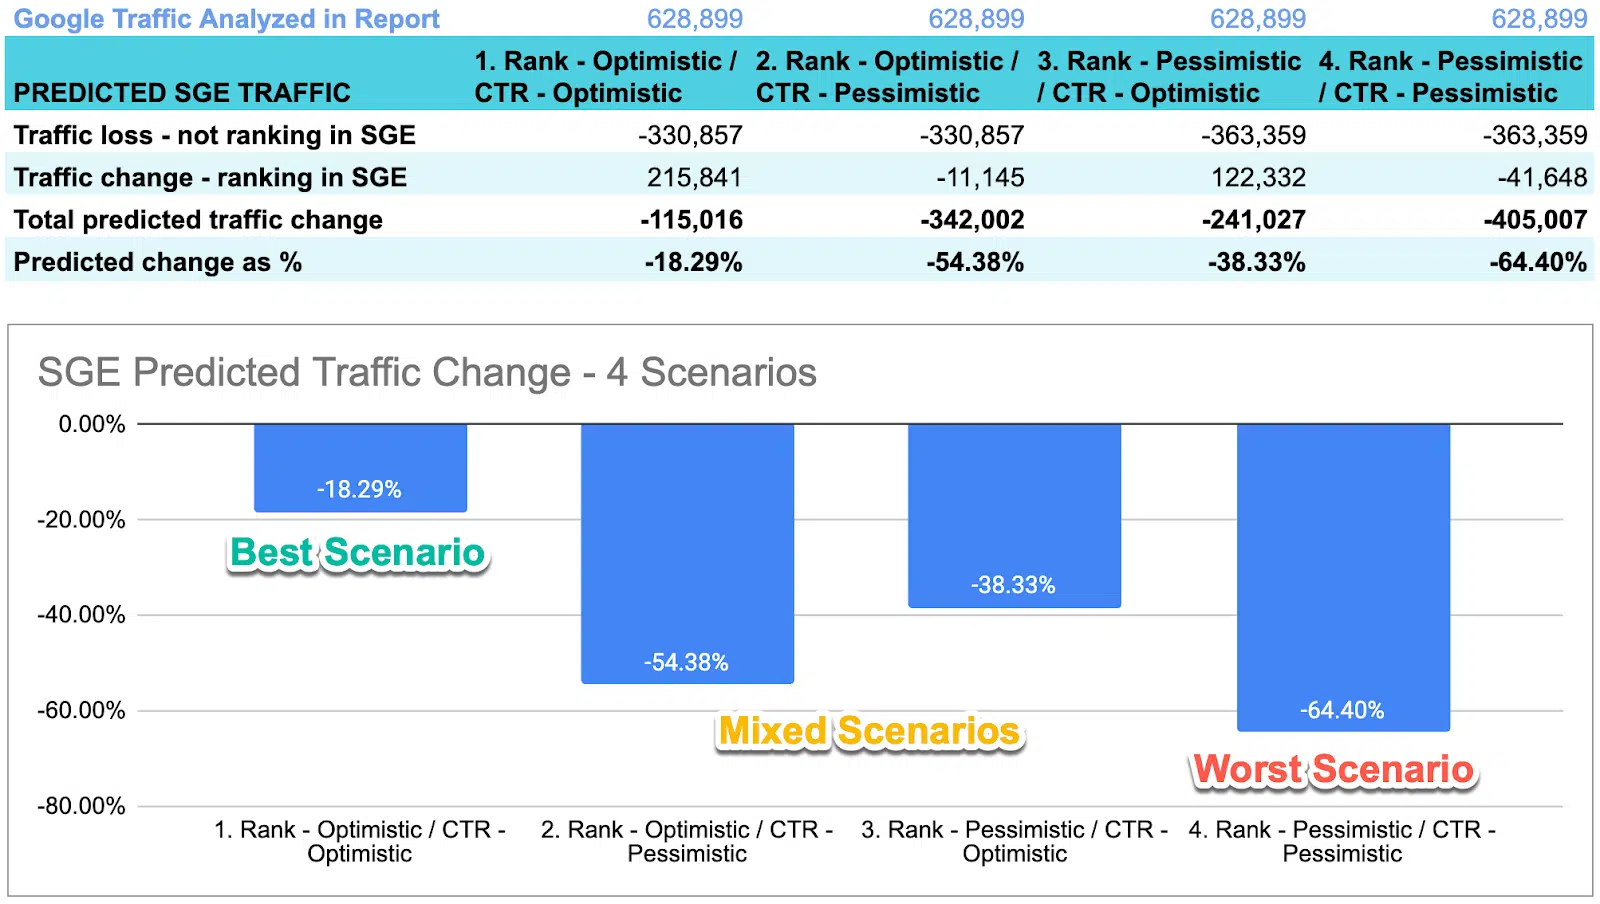
The columns of the table and the four bar charts show our four scenarios:
- In the best scenario the websites drop by 18% in relevant organic sessions. Here we estimate a relatively high CTR (roughly the same as in Google today) and we’re taking the best rank seen for each keyword.
- In the worst scenario, the websites drop by 64%, wiping out 405,000 monthly organic traffic sessions – ouch. Here we estimate that CTR in Google SGE will be half of what we have in Google today, and we assume that if a keyword isn’t ranking in even one observation, it doesn’t rank at all.
- In the mixed scenarios (with optimistic rank / pessimistic CTR or vice versa), there are still significant drops of 38-54%.
What is most significant is that even in the most optimistic scenario, SGE results in significant traffic drops.
If we take the pessimistic assumption on just one of our parameters (rank or CTR), those traffic drops increase by 2X-3X.
Traffic per website in SGE
The aggregate data hides important differences between the websites.
Below is a table showing the data of all 23 websites, the number of high-impact keywords, current organic traffic, and expected traffic change in Google SGE.

In our sample of 23 websites, some actually experience traffic growth in SGE.
This is because they have important keywords that are ranking better in SGE, and driving more traffic, compared to the current situation.
We highlighted two such examples in green: most notably, website #4 is growing traffic by a massive 219% in the best scenario.
These cases give us hope, because they show that with certain assumptions, it is possible to actually grow traffic in Google SGE. We also experienced this in two of our SGE recovery case studies (see below).
On the downside, some websites are very hard hit – see the two examples highlighted in red. For example, website #16 is dropping by over 90% across all scenarios.
Across all websites in our sample, there is undoubtedly a major cause for concern. This brings us to the next stage of the discussion: what can we do about SGE traffic drops?
An experimental framework for SGE optimization
Let’s start from the end. Here is the first keyword we managed to optimize to get our client into position 1 on the SGE snapshot carousel.
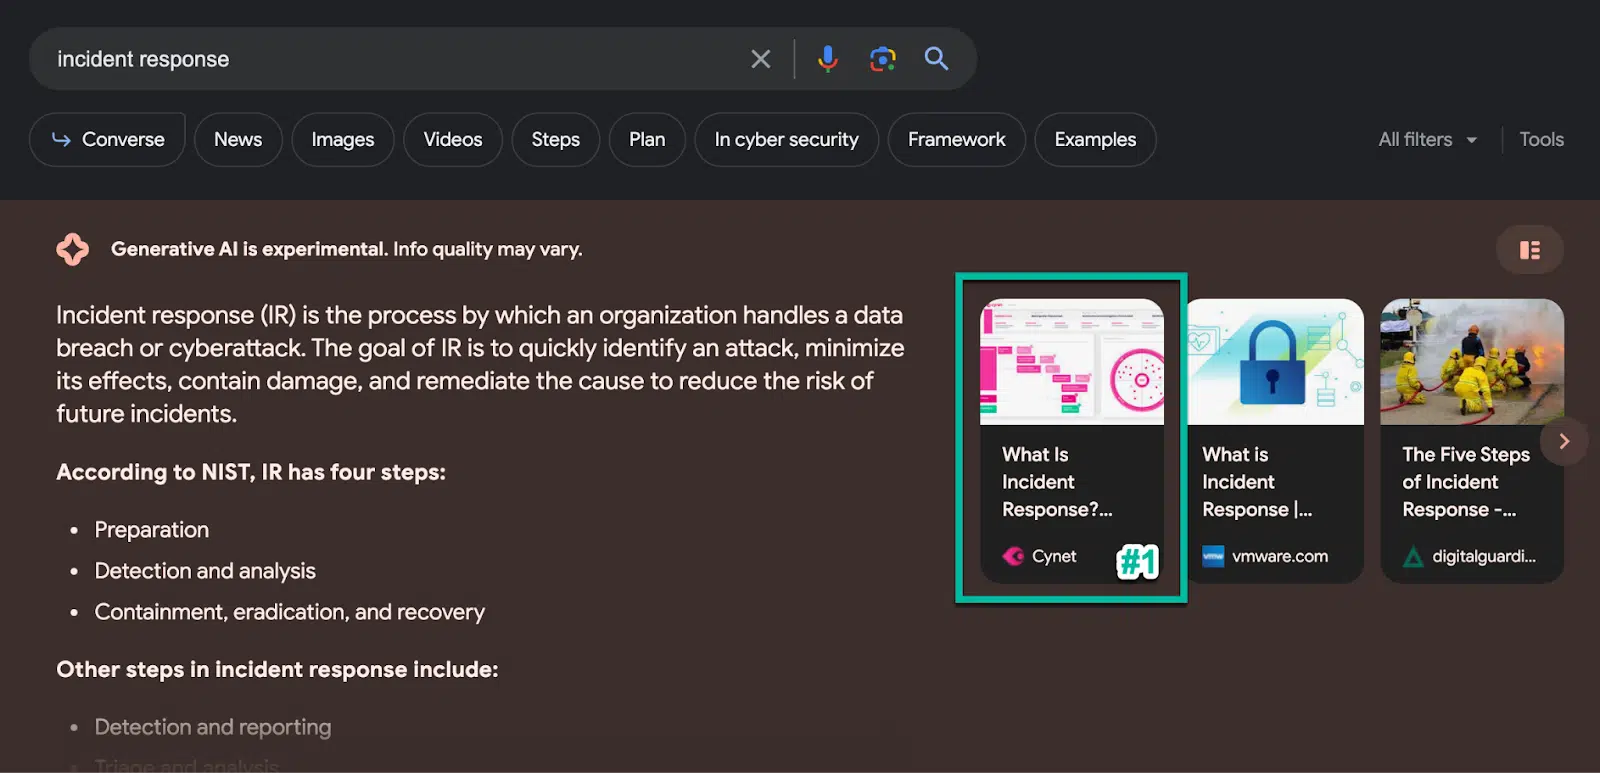
This page originally ranked between position 1-3 on Google for the keyword [incident response], but in SGE, it wasn’t ranking.
We applied an intervention, and now the page has been ranking consistently in the top positions in SGE for over two months.
This is what we need to achieve – identifying pages that are not ranking in SGE, and getting them to rank as high as possible in the snapshot carousel (or more accurately, as far as possible to the left).
4 rules for a useful SGE experiment
The following conditions will help you carry out useful experiments to discover how to achieve the result shown above:
- Focus on one page at a time: The intervention should be limited to a specific page / keyword, keeping site-wide factors constant.
- Focus on factors within your control: For example, if you don’t control the content or design of the page, those factors cannot be part of your experiment.
- Carry out the intervention in the space of one week: This is important because SGE ranks change fast. If you make a change and measure the result in the space of one week, there is a lower chance the result is due to a random rank change.
- Use a control group: Find a group of comparable pages / keywords and observe their ranks, in parallel to carrying out your intervention. If their ranks remain stable (on average) and your experimental page improves in rank, you have a winner.
You might say that this framework is too limiting, because it does not consider site-wide factors, or anything that cannot be manipulated in the space of one week.
This is true, but think of it this way – if you can find a method that satisfies these rules and works, you have something you can easily use to recover from SGE traffic drops.
Our SGE experiment results
Following the rules above, we conducted an experiment to try to optimize pages to appear in the SGE snapshot carousel.
We tried to optimize 14 keywords across three websites – these are currently in the top 10 positions of Google but do not appear in the SGE carousel.
We used two intervention methods (A and B), involving both on-page and off-page factors (7 keywords for each intervention).
In parallel, we tested a control group of similar keywords on the same websites, for which there was no intervention.
Before the experiment, we checked the rank of all 14 keywords for each intervention in two Google accounts:
- Account 1 → no keywords ranked in citations
- Account 2 → only 2 ranked
After intervention A, we checked the ranks of the 7 keywords in three Google accounts:
- Account 1 → no keywords ranked in citations
- Account 2 → 2 ranked
- Account 3 → no keywords ranked in citations
After intervention B, we checked the ranks of the 7 keywords in three Google accounts:
- Account 1 → 6 ranked in top 3, 1 no SGE
- Account 2 → 6 ranked in top 3, 1 no SGE
- Account 3 → 6 ranked in top 3, 1 not ranked
Control group:
To check if pages naturally improved and entered SGE unrelated to our experiment, we checked a control group of 89 keywords, which were previously not ranking in the SGEsnapshot carousel:
- 21% of these keywords entered the snapshot carousel during the week of the experiment.
- 79% were still not ranked in snapshot carousel.
This shows that the odds of a keyword entering the snapshot carousel ‘by chance’ is 21%. However, in our experiment we managed to get 93% of tested positions (15 of 16 ranks when SGE was active) into the snapshot carousel. This proves the intervention resulted in rank change.
As a result, we concluded that intervention B was successful in achieving SGE rank, for top 10 rank keywords, which are not currently ranked in SGE.
Note
We are not sharing our technique here, because it was developed for our specific use case of informational keywords in the technology/SaaS market. It’s well-documented that the Google algorithm works differently in different niches and for different types of keywords.
So there will probably be different techniques for every niche. We shared our general experimental framework, which anyone can use to find a technique for their specific use case.
Process for an SGE recovery project
Once you find a repeatable technique that can achieve SGE ranks for your high-impact keywords, you can design a full SGE recovery project for a website using this process:
Step 1: Perform SGE impact analysis (as shown above).
Step 2: Make a list of keywords that are either:
- Strategic and currently ranking in the top 10 and not ranking in Google SGE. We call this “strategic rank loss.”
- Driving high traffic and expected to have less traffic in Google SGE, according to the worst scenario. We call this “maximum traffic impact.”
Step 3: Prioritize the keywords as follows:
- First, take the strategic keywords your business absolutely cannot afford to lose rank for.
- Second, take the keywords with highest traffic impact (you can weed out keywords that have lower search intent for your business).
Step 4: Optimize existing pages using your experimental technique.
Step 5: Other options for achieving SGE rank:
- Identify an “ideal page” that could rank better, given the ranking factors you identified, and create that page. In many cases, the new page will rank in SGE.
- Identify another page that has the required parameters but is not well-focused on the keyword. Rewrite it to focus on the keyword you need to rank in SGE.
Step 6: Rerun SGE impact analysis and see if you have managed to:
- Reduce the number of keywords losing rank.
- Mitigate the traffic drop, at least across some of the four scenarios.
Since we discovered this process, we have successfully carried it out for several clients. Below are the results we achieved.
3 SGE recovery case studies
From the moment we discovered how much of a threat SGE represents, we were laser-focused on one goal – mitigating the risk of SGE and saving our clients from the expected traffic drops. We have completed three successful SGE recovery projects, and are excited to share the results.
Note: We are not sharing the names or domains of our clients to protect their privacy. However, we are able to share this information, in confidence, with members of the press or prospective clients. If you are interested, please reach out to us.
Case 1: Cloud native developer tool, 175,000 monthly organic sessions
Background
- Corporate website with product pages, blog and learning center.
- 755 indexed pages.
- Organic traffic grew from 21,000 in September 2021 to 174,000 on average in 2023 Q3.
- SGE recovery project focused on 135,000 visits driven by 38 keywords.

SGE impact analysis
- Before the project, the website was expected to:
- Lose rank for 7 strategic keywords.
- Lose between 60,000 (44%) and 102,000 (75%) of organic traffic, depending on SGE scenario.

- What we did
- Optimized 9 existing pages for SGE snapshot carousel, using our experimental technique.
- 8 out of 9 entered the SGE snapshot carousel (88% success rate).
- Wrote 8 new “ideal pages” we felt could rank better in SGE, and applied relevant off-page factors.
- 3 out of 8 entered the SGE snapshot carousel (37% success rate).
- Optimized 9 existing pages for SGE snapshot carousel, using our experimental technique.
- After the project, the website is expected to:
- Lose rank on only 2 strategic keywords – saved 4 keywords.
- Drop only 5% in the best scenario (compared to 44% before the project).
- Drop 57% in the worst scenario (compared to 75% before the project).

Evaluation
We have mitigated the risk for this client in the best scenario. A significant risk remains in two other scenarios. It is possible to continue and optimize more keywords to completely mitigate the risk across all scenarios.
Case 2: Enterprise cloud platform, 35,000 monthly organic sessions
Background
- Corporate website with product pages, blog and learning center.
- 1,250 indexed pages.
- Organic traffic grew from 10,000 in January 2021 to 45,000 in 2023 Q2. Traffic dropped to 35,000 in 2023 Q3 due to site relaunch.
- SGE project focused on 19,000 visits driven by 68 keywords.

SGE impact analysis
- Before the project, the website was expected to:
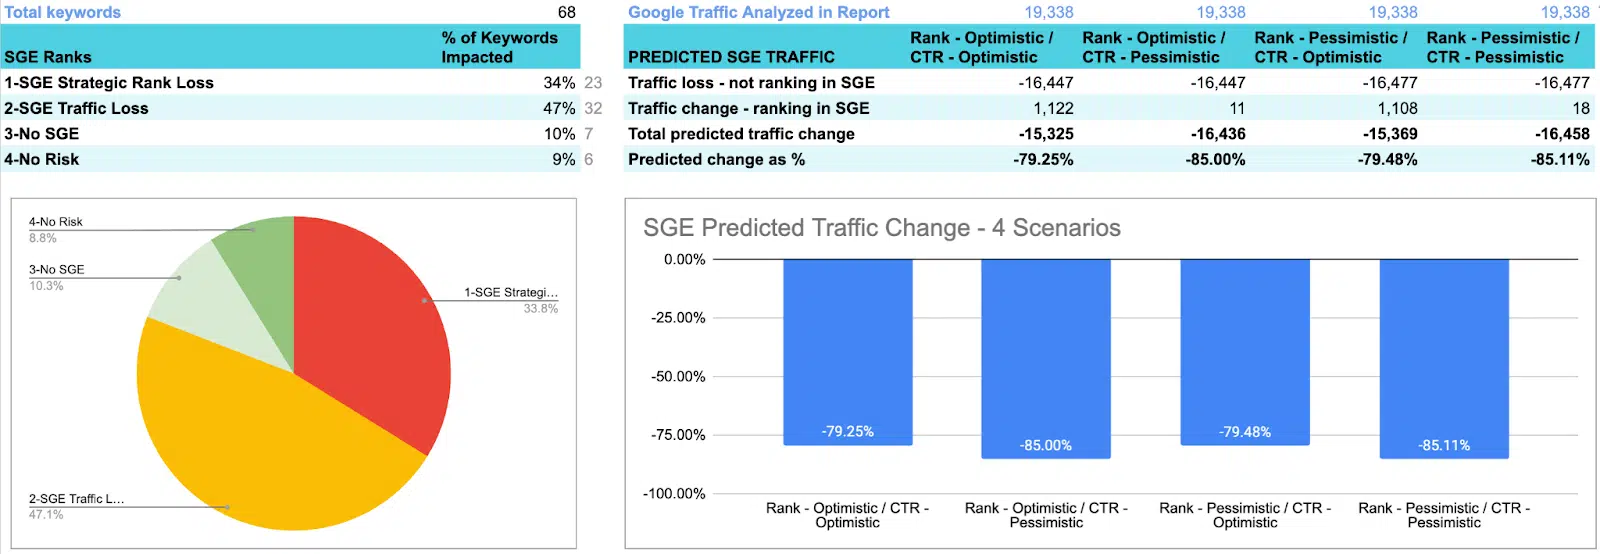
- Lose rank for 23 strategic keywords.
- Lose between 15,000 (79%) and 16,000 (85%) of organic traffic, a massive traffic drop.

- What we did
- Optimized 11 pages for SGE snapshot carousel, using our experimental technique.
- 8 out of 11 entered the SGE snapshot carousel (72% success rate).
- Wrote or rewrote 4 pages to create “ideal page” for ranking in SGE, and applied relevant off-page factors.
- 3 out of 4 entered the SGE snapshot carousel (75% success rate).
- Optimized 11 pages for SGE snapshot carousel, using our experimental technique.
- After the project, the website is expected to:
- Lose rank on only 6 strategic keywords – we saved 17 strategic keywords (there were several strategic keywords ranking with the same page).
- Actually grow 97% in the best scenario – or between 2-28% in mixed scenarios.
- Drop only 31% in the worst scenario (compared to 85% before the project).

Evaluation
We managed to completely turn SGE impact around from a massive traffic drop to a potential increase of almost 100% in organic traffic (in the best scenario).
In addition, we saved 17 strategic keywords that were losing visibility in SGE.
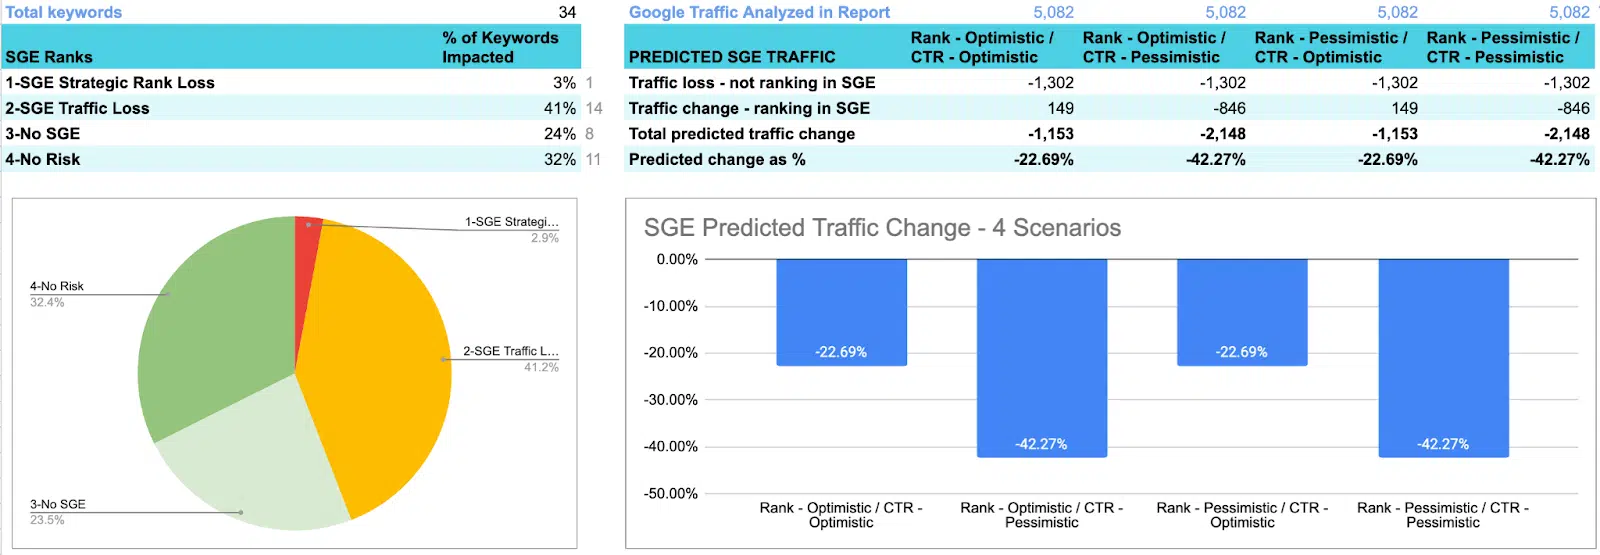
Case 3: Cybersecurity solution, 15,000 organic sessions per month
Background
- Corporate website with product pages, blog and learning center.
- 888 indexed pages.
- Organic traffic grew from 3,000 in January 2022 to an average of 15,000 in 2023 Q3.
- SGE project focused on 5,000 visits driven by 34 keywords (the rest of the traffic is less important to the business due to change in strategic focus).

SGE impact analysis
- Before the project, the website was expected to:
- Lose between 1,100 (22%) and 2,100 (42%) of its valuable organic traffic.
- What we did
- Optimized 3 pages for SGE snapshot carousel, using our experimental technique.
- 2 out of 3 entered the SGE snapshot carousel (66% success rate).
- Wrote or rewrote one pages to create “ideal page” for ranking in SGE, and applied relevant off-page factors.
- The page entered the SGE snapshot carousel (100% success rate).
- Optimized 3 pages for SGE snapshot carousel, using our experimental technique.
- After the project, the website is expected to:
- Actually grow 84% in the best scenario – or move between growth of 11% to a minor drop of 9% in mixed scenarios.
- Drop only 34% in the worst scenario (compared to 42% before the project).

Evaluation
This is an example of a relatively small SGE traffic drop which was largely mitigated by optimizing only four pages.
This shows the importance of focusing on the right keywords and opportunities in SGE recovery.
Conclusion and next steps
Despite many important insights shared about Google SGE, we have not seen concrete advice explaining how SGE will affect websites and what they can do to recover.
Hopefully, this article contributes to the understanding of Google SGE in three main respects:
- Impact: Understanding what is likely to be the impact of Google SGE on specific websites, in concrete terms – what keywords will lose rank and how much organic traffic is at risk – using our open SGE impact report.
- Action: Understanding what we can do to mitigate specific rank and traffic drops identified by the impact model via our experimental framework, which we have used to execute successful SGE recovery projects.
- Hope: Our experience proves that even if SGE poses a risk to the organic traffic you have built in your SEO projects, it is possible to adapt your practices to this new search experience and recover. It is not – as some have claimed – the end of SEO. Rather, it is the beginning of a new and exciting era.
SGE Recovery Webinar
- On Thursday, Sept. 28 at 1 p.m. ET, I will hold a free webinar – Overcoming the Google SGE Challenge: Assessment and Recovery Strategies – in which we’ll go into more depth about the SGE Impact Model, our experimental framework, and our SGE recovery case studies, and take questions from the audience. Save your spot.
We hope this article will spur a community effort to gather more data and find solutions for SGE in a variety of niches.
Here’s to the next 20 years of SEO!
Opinions expressed in this article are those of the guest author and not necessarily Search Engine Land. Staff authors are listed here.
Related stories
New on Search Engine Land
About the author