How to track Performance Max campaigns with Google Apps Script
Learn how to work around PMax's limited reporting and insights using a script to pull data on Google Ads campaign spend breakout.
If you manage ecommerce PPC accounts in Google Ads, you likely have used Performance Max campaigns since mid-2022. You also know that the insights and reporting are limited.
We can’t control how much of our budget goes to top-of-funnel strategies like video, display and discovery campaigns.
We can’t see how that spend is broken out through Google’s automation.
Learn how to overcome this hurdle using Google Apps Script to pull data on campaign spend breakout and glean insights to improve performance and impress your clients and team.
Why use Apps Script in Google Ads, Performance Max?
Apps Script is a Google tool enabling you to automate actions in Google Ads using JavaScript code in your account. (Don’t worry, no coding experience is needed for this guide!) This saves time and simplifies management.
Due to a lack of control and insights from Performance Max, some advertisers opt to use standard Shopping campaigns.
While the Insights tab in Google Ads shows audience insights, search term insights and general performance, it does not include the breakout of spend or impressions by campaign type.
If you see high impressions on a campaign or asset group with similar clicks to other campaigns or asset groups, you can only assume that video or display campaigns (awareness-based campaigns with high impressions) were shown over search or Shopping ads.
A script to monitor performance
Mike Rhodes was kind enough to create and share a script with the digital marketing community through GitHub. The most recent version is the 24th, released in April 2023.
Instructions on installing the script begin with copying this template in Google Sheets.
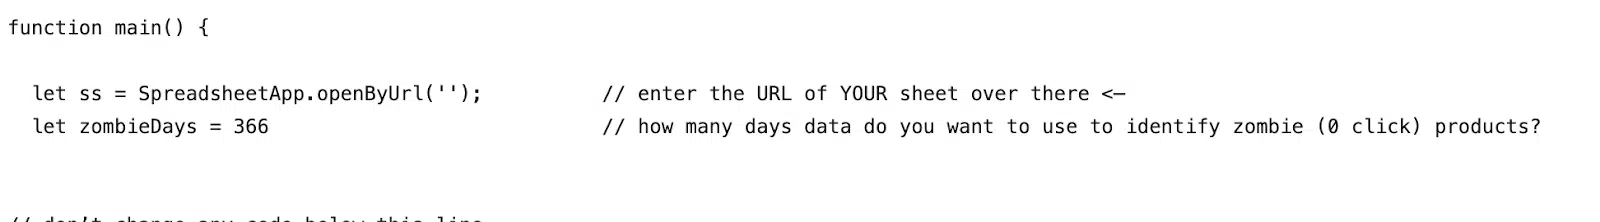
Now grab the URL of your sheet and enter it below in the line that starts with let ss =. Put the URL between the single quotes.
Next name your script: “YOUR CLIENT”: pMax Charts
Name your sheet: “YOUR CLIENT” – pMax charts v24 (updates daily)
Google will then ask you to authorize the script to access your Google Ads account. Please note that this won’t change or update your ads in any way. It will only extract the data to send to Google Sheets.
Once authorized, save and run your script!
You want to set up your script to run daily. I recommend running it early morning when you won’t be in the Google Ads system.
Insights from the report
Now that you have your report running, you can pull insights from the report. The report shows only the past 30 days.
One great thing is to see how Google prioritizes campaign types.
In the example below, you will see that consistently for the past 30 days, this campaign has allocated 100% of its cost toward Shopping ads. Please note that “Other” is predominantly search ads.
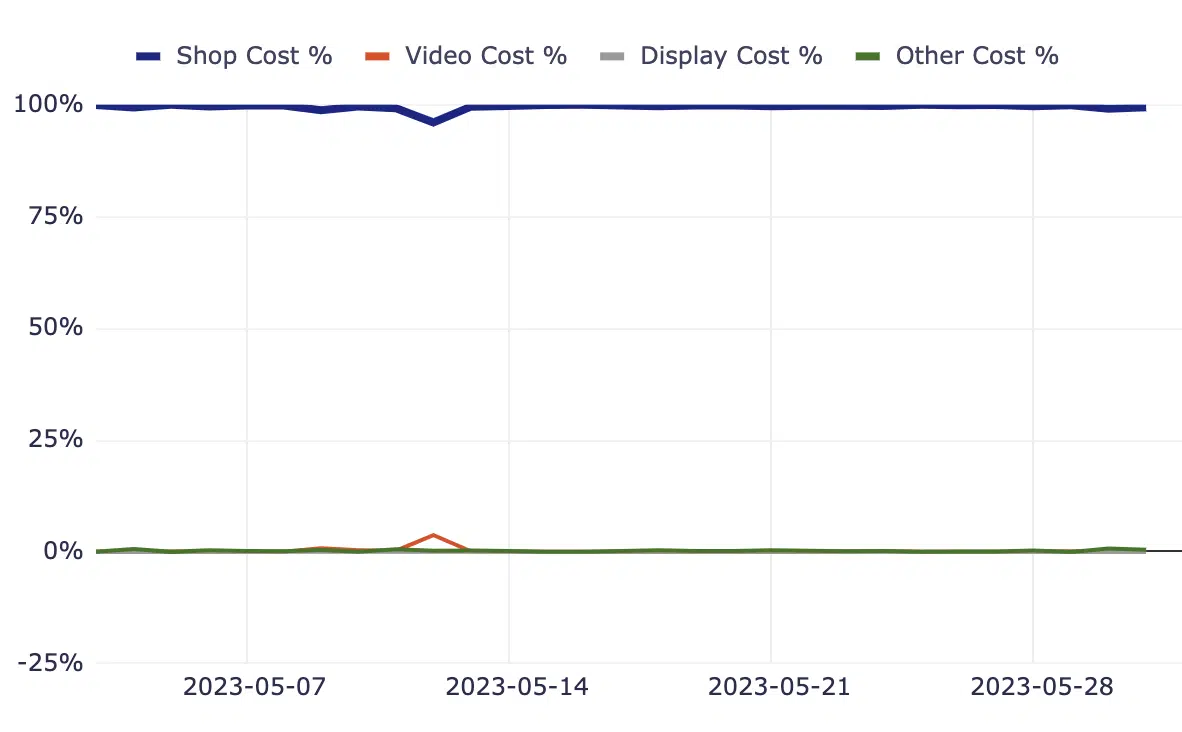
This can signal that the products in this category consistently show Shopping ads as the top-of-page results on the SERP.
In the example below, on the same account, you will see that the campaign shows a majority of Shopping ads with the budget, but it also shows search and video.
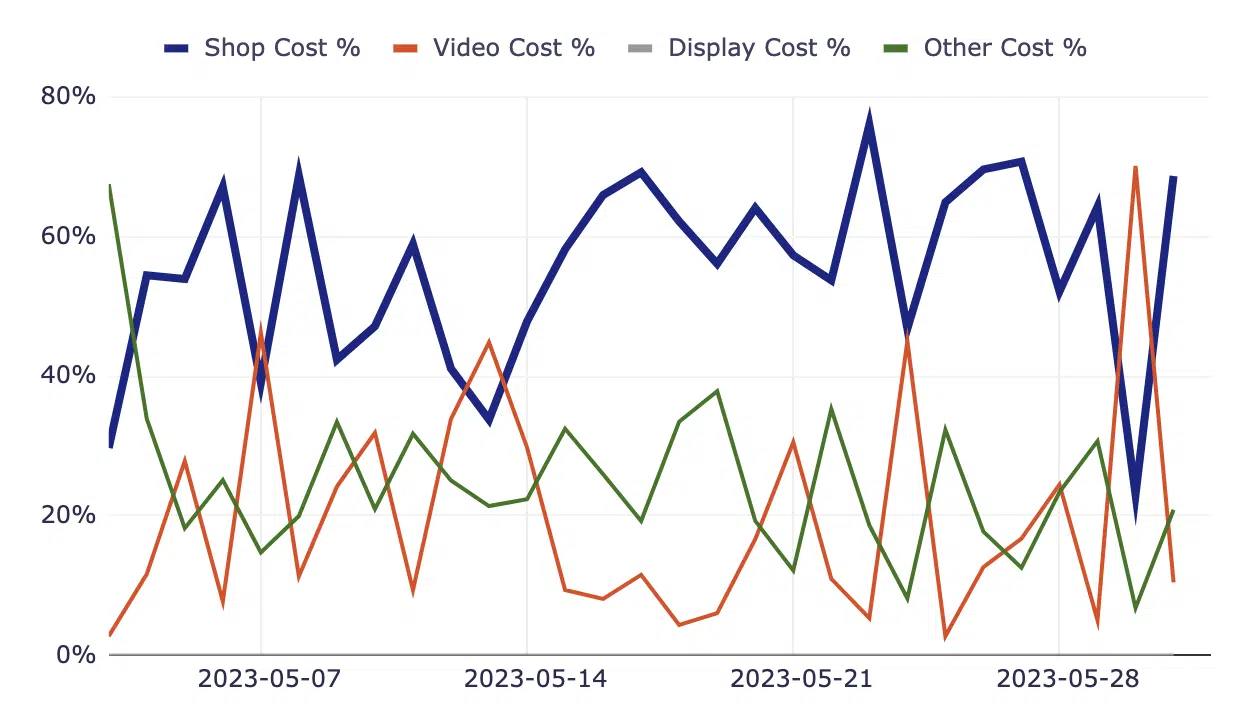
Try making test searches to see if these searches for the products in this particular campaign show consistent Shopping results at the top of the SERP or if the results are often search ads. This can explain the lower Shopping distribution.
Another thing that may signal this is the ROAS. If you are using tROAS on the campaign and are consistently below the target, Google may try different campaign types to hit that tROAS if it recognizes that Shopping ads will not accomplish that.
Optimizations from insights
Use these insights and predictions to run tests!
In the first example, where all spend went to Shopping, try pushing the limits of what ROAS you can achieve by incrementally increasing your Target ROAS bid.
In the second example above, try decreasing your Target ROAS bid to see if the Shopping ad spend distribution increases.
I recommend only increasing in increments of 25-50% to avoid causing a sudden drop in performance.
In the example below, you will see that the week of May 7, we increased our ROAS target too drastically.
It caused our performance to plummet, signaled by a sharp increase in impressions due to Video ads being shown.
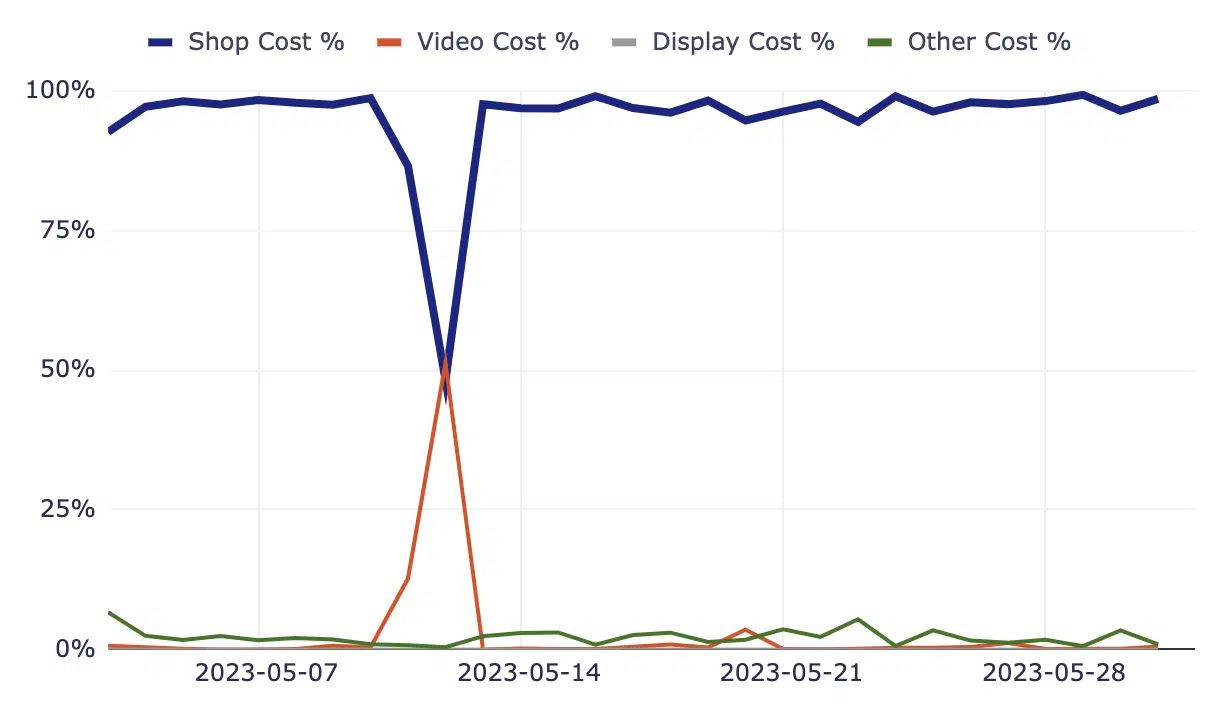
Using this tool, we were able to track the allocation daily and return our ROAS target to its original goal.
The report also has tabs with table views of data by campaign and asset groups.
Beyond that, there are tabs with charts showing asset group performance by:
- Impressions
- Cost
- Conversion Value
Below is an Asset Group report by Impressions from a campaign with four asset groups. The In Market / Affinity audience receives many more impressions than its counterparts.
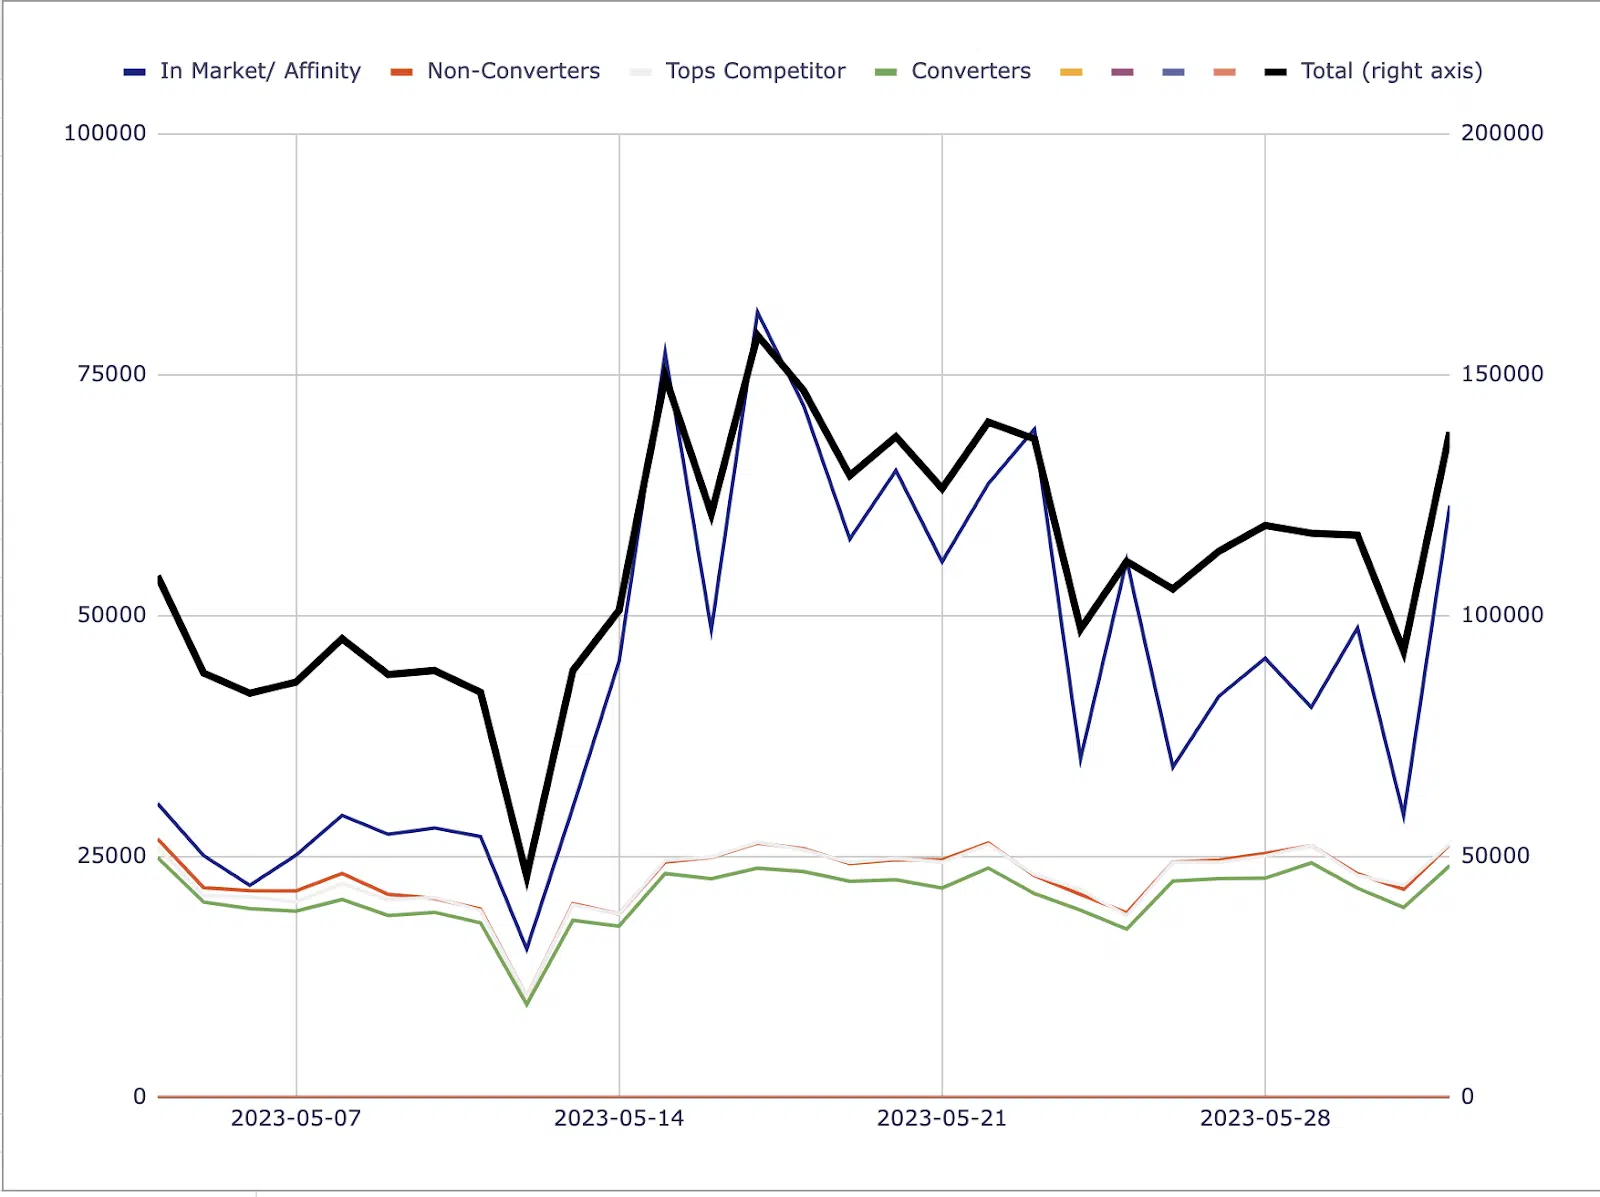
You’ll want to investigate the first chart again. Does this campaign have high video or display spend allocation? Could that explain the high impressions on that particular asset group?
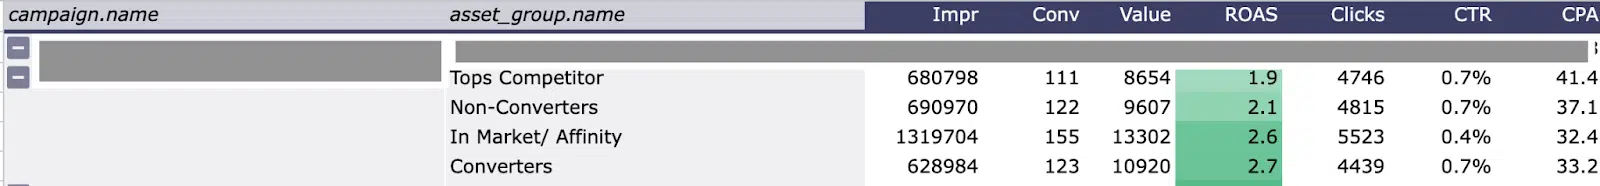
You’ll also want to check the chart report by asset group. You will see the high impressions on In Market/ Affinity, but we also see the lowest cost per acquisition of any asset group in that campaign!
Now use this information to update audience signals across other campaigns that match this asset group, and do the same with your assets.
Filling the data gaps through scripts
Try other available scripts based on your clients’ needs and learn Google Apps Script to build your own.
As Google pulls back data and control from marketers, there are ways we can fill the gaps in data by using scripts shared throughout the digital marketing community.
Opinions expressed in this article are those of the guest author and not necessarily Search Engine Land. Staff authors are listed here.
Related stories
New on Search Engine Land
About the author