
Fresh insights from the Revenue Benchmark Report 2023
Published:

Earlier this year, our data scientists analyzed 570 million interactions across the Salesloft platform and aggregated the numbers into a spate of benchmarks for sales teams.
This trove of data is useful for grab-and-go benchmarking for prospecting and coaching motions. But we wondered what other stories we could distill from the figures.
We revisited the guide and asked several sales pros to extract four insights from the benchmark report and drop them into a guide that we’re calling, quite appropriately, the Top 4 insights from Revenue Team Benchmark Report 2023.
If you happen to be a sales coach or manager, this guide offers several narratives you can carry into your conversations with sellers. You can also reference the data points to see where you might tweak a few benchmarks — or even kick off a “back to basics” sales initiative with your team.
In this article, we’ll skim the surface of the insights guide so you can see what we found.
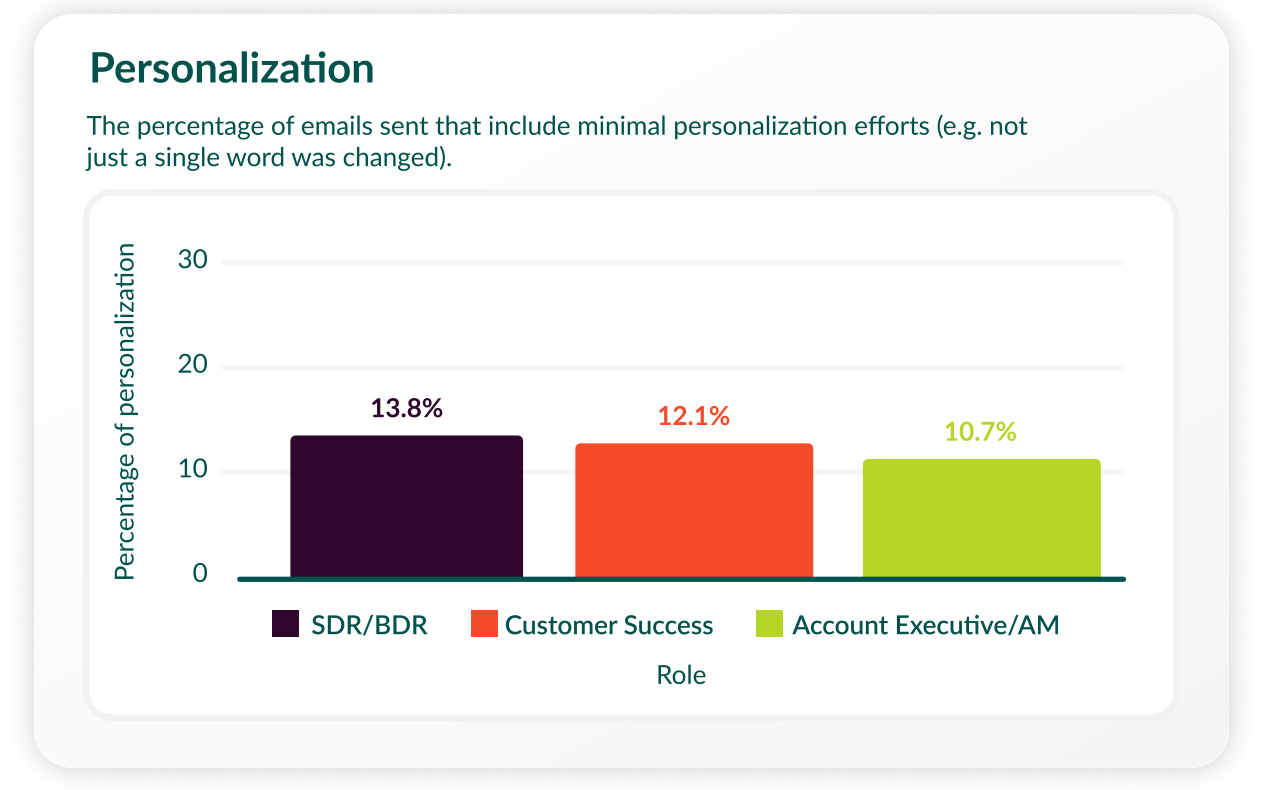
Insight 1: There’s more opportunity to personalize emails
Across all 20 industries in the report, personalization averaged between 10% and 14%. This means at least 86% of all emails sent, no matter the industry, included no personalization whatsoever.
Key takeaways per role:
- CSMs have the highest reply rate of any group since they are working existing relationships; however they are seeing less than 1 in 5 replies.
- Account Executives, we suspect, are taking on more prospecting responsibilities and showed the lowest rate of personalization (10.7%) among the roles we researched.
- SDRs are sending 150 emails per week on average, but they only get a 2.8% reply rate on average. This suggests that it’s taking a massive volume of emails for these roles to meet pipeline quota.
Tip: Read the full guide to see a few of our proven tips and takeaways, including a multi-tiered approach that has helped our team drive more scalable email campaigns with personalization.
Insight 2: Your ICP might be bigger than you think
If you’re in B2B sales and you also happen to sell software within and to tech companies, a few things are extremely obvious right now. It’s crowded, the messaging is homogenous, and creating new opportunities is harder than it should be.
Case in point:
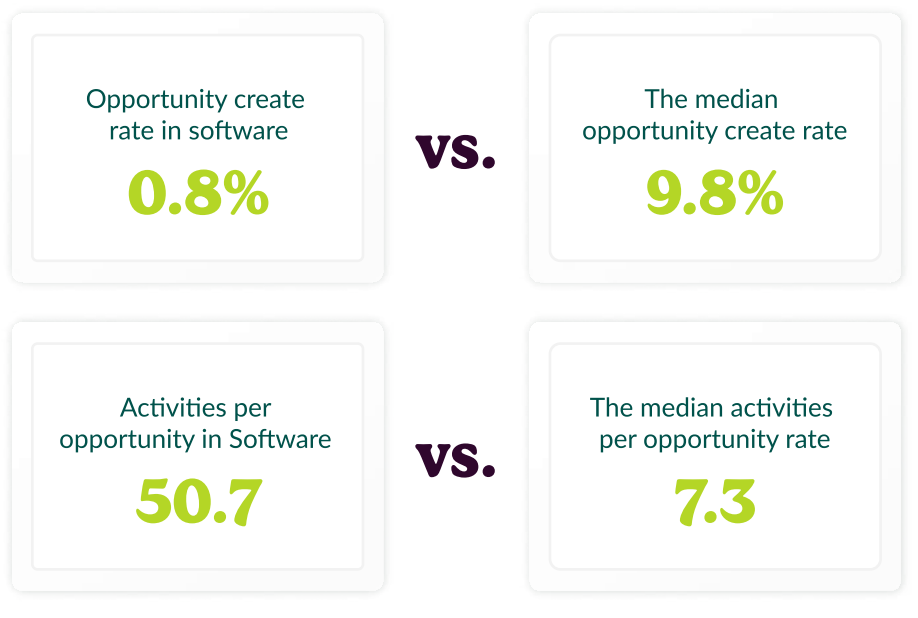
So what are sales teams in these industries to do? One theory: move to a quieter room. Selling outside of your typical Ideal Customer Profiles (ICPs) could help you find a more receptive audience.
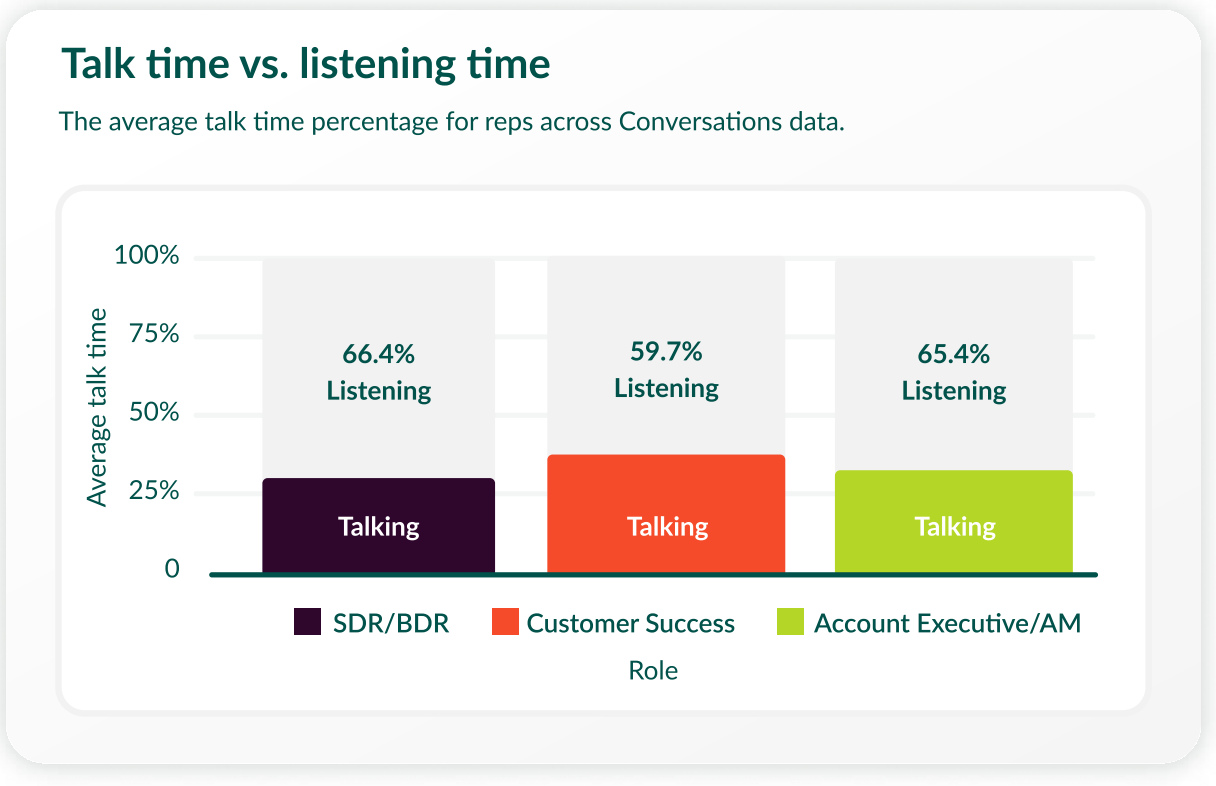
Insight 3: Silence is golden. Manage talk time.
A well-executed call can lead to meaningful conversations and, ultimately, more closed deals. But some younger sellers can feel daunted by the vulnerability of objection and, as a result, they miss out on the benefits of a live conversation.
For SDRs, the phone continues to be the best way to get in touch with prospects and customers across all of the industries we reviewed, greatly surpassing email replies.
Training and culture are crucial here, as it takes more than just talking to win.
Time and time again we see that reps who listen more tend to meet and exceed their goals. Top performing reps are masters at asking probing questions and learning from past exchanges with buyers through conversation intelligence.
Insight 4: The deal is in the details
To navigate deals successfully, sellers must invest the time and effort in relationship-building activities across various departments and levels within a customer’s organization.
Intentionality at every single customer touch point is now the only way to win business. Successful sellers are proactive: they conduct thorough research on prospects, infuse value selling to address customer pain points, and can win over decision makers all the way up to the C-suite.
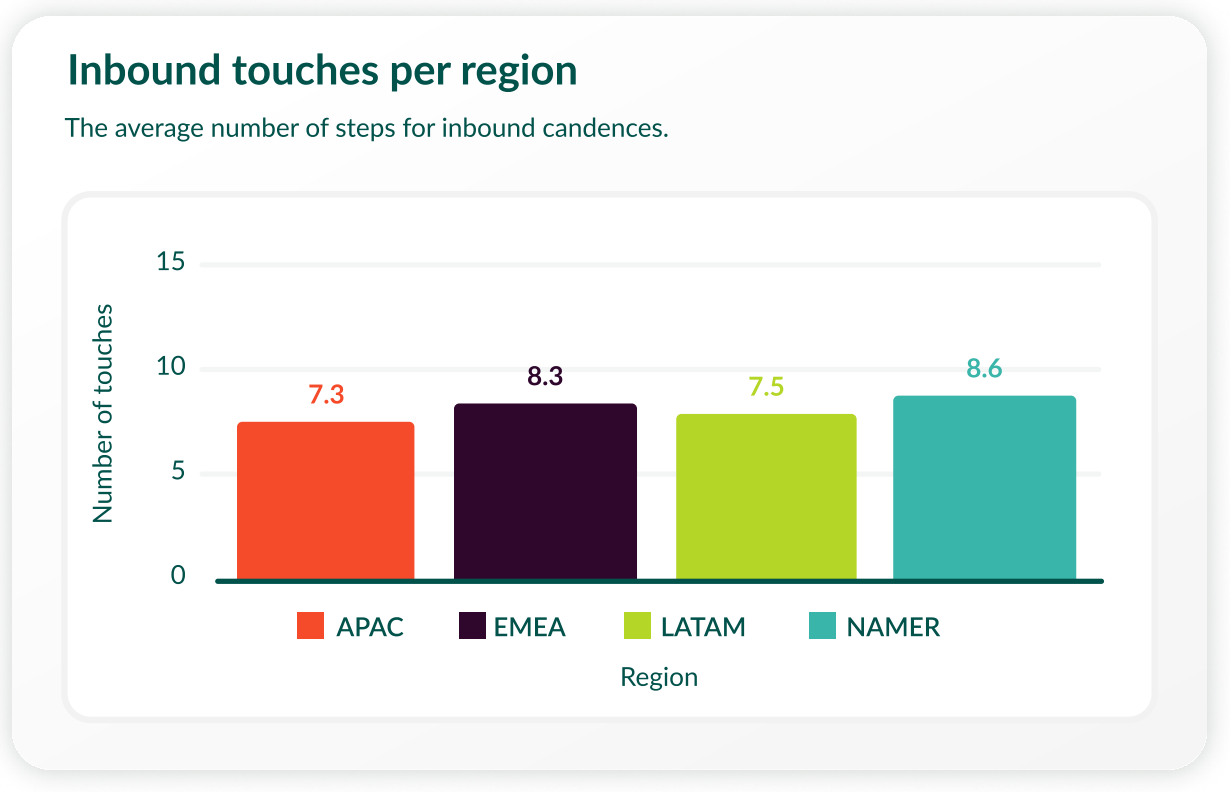
We cover this and more in the guide, including:
- Inbound touches by role
- Activities per week per user
- Activities per opportunity
- Win rates by region
- Deal gaps
Download the guide
The Top 4 insights from Revenue Team Benchmark Report 2023 is a great reference for managers who want to fine-tune their team’s current benchmarks. Use it to reassess your email personalization, upgrade your phone game, or even venture outside of your typical ICP audience.
Recommended for you: