article thumbnail

What is A/B Testing? The Complete Guide: From Beginner to Pro

ConversionXL

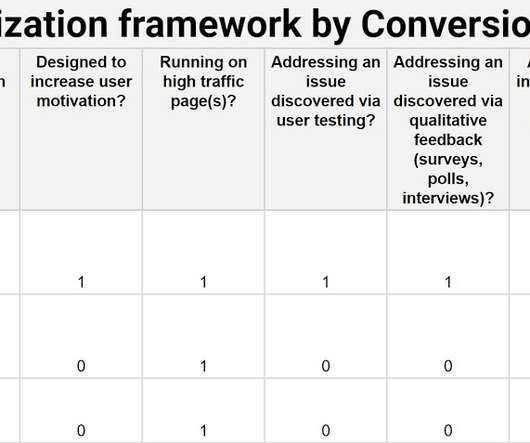
A/B testing splits traffic 50/50 between a control and a variation. A/B split testing is a new term for an old technique — controlled experimentation. Yet for all the content out there about it, people still test the wrong things and run A/B tests incorrectly. Table of contents What is A/B testing?

article thumbnail

A/B Testing Mastery: From Beginner To Pro in a Blog Post

ConversionXL

A/B testing – for all the content out there about testing, huge amounts of people still mess it up. From testing the wrong things to running the tests incorrectly, there are lots of ways to get it wrong. What is A/B testing and How Does It Work? What to Test to Improve Our Chances of Winning?

Insiders

Sign Up for our Newsletter

This site is protected by reCAPTCHA and the Google Privacy Policy and Terms of Service apply.

Trending Sources

article thumbnail

Finding The High Converting PPC Keywords That Are Right Under Your Nose

ConversionXL

AdWords Editor makes copying Campaigns really simple, and AdWords has added a copy function within the native web app itself, also. What this means to you as a PPC manager is that your search term reports will contain more regionally-focused language. People in different areas use different language , including when they’re searching.

Territory 111
article thumbnail

SaaStr Podcasts for the Week with G2 and Gorgias — September 27, 2019

SaaStr

What are the core differences when comparing marketing functions at the likes of Salesforce to smaller companies like G2? None of the regions really do anything to drive inbound in the original sense of the word, so inbound meaning blog traffic, because we had a massive and an amazing content team over at headquarters in Boston at HubSpot.

article thumbnail

Data Visualization for Marketers: Do’s, Dont’s, and 6 Expert Tools

ConversionXL

I interviewed Tina Donati, Head of Marketing at Alloy Automation, to learn how each marketing function can use data visuals: Use data visuals internally—extensively. Bubble charts display three dimensions of data: an x-axis, a y-axis, and the size of the data point. Bubble charts and maps. The tool isn’t one to pick up immediately.

article thumbnail

SaaStr Podcast #390 with Outgrow Co-founder Randy Rayess

SaaStr

And so what we’ll see people come in and do is they’ll say, Hey, we want to acquire name, email, company size, function, or department, and then the consent and all these fields, right? And what do you advise on like A/B testing? And so they’re saying, okay, we want to acquire this information.

article thumbnail

Mastering Mobile Popups

ConversionXL

For example, the most common screen size is still 780 x 1280 pixels. The Asia-Pacific region is the most-significant online market globally, and Australia is one of Asia Pacific’s most highly developed ecommerce markets. Note, this wasn’t an A/B test. Mobile traffic, however, presents an entirely new set of challenges.